pythonjupyter notebookmatplotlibplotly
2024 Stack Overflow Developer Survey Analysis
Interactive dashboard built using Python, Streamlit, and Plotly to analyse insights from the 2024 Stack Overflow Developer Survey. Explores trends in salary, roles, languages, and geography.
Published
January 2025
Unlocking Insights into AI Adoption, Salary Trends, and Developer Productivity
Welcome to the 2024 Stack Overflow Developer Survey Analysis! In this project, I explore developer trends, technology adoption, AI integration, and job satisfaction using insights from over 65,000 developers worldwide.
Through data cleaning, exploratory analysis, and visualisation, I uncover key insights into how developers work, learn, and interact with AI & Stack Overflow.
📝 Introduction
Why This Project?
The Stack Overflow Developer Survey is one of the largest and most comprehensive datasets on software development. By analysing this dataset, we can:
✅ Identify the most popular programming languages & tools.
✅ Understand how AI is shaping developer workflows.
✅ Explore salary trends & job satisfaction.
✅ Identify developer frustrations & challenges.
📊 Dataset Overview
📥 Data Source:
🔗 The dataset was downloaded from Stack Overflow's Official Survey
📂 Structure of the Dataset:
- —65,437 responses from developers worldwide 🌍
- —114 columns covering
- —🌐 Programming languages, frameworks, and tools
- —🤖 AI adoption & trust in AI-generated code
- —💰 Salaries & job satisfaction
- —🚀 Learning resources & Stack Overflow usage
🛠️ Data Cleaning & Preprocessing
🔎 Steps Taken:
1️⃣ Checked for Missing Values
- —Many columns had high missing values (e.g.,
AINextMuch less integrated,EmbeddedAdmired). - —Dropped columns with >50% missing data.
- —Filled missing categorical values with
"Unknown". - —Filled missing numerical values with median values.
2️⃣ Checked for Duplicates
- —Removed all duplicate rows to avoid redundancy.
3️⃣ Fixed Data Types
- —Converted salary & experience fields to numeric values.
- —Standardised categorical values (e.g.,
"Yes","yes","YES"→"yes").
4️⃣ Ensured Data Consistency
- —Fixed multi-select fields (e.g., split languages & tools into separate counts).
📈 Exploratory Data Analysis (EDA)
1️⃣ Developer Demographics
📌 Age Distribution
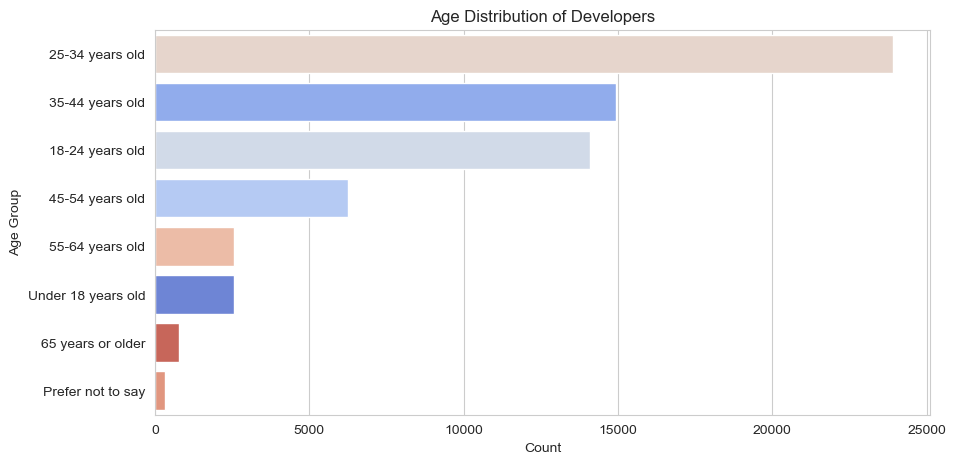
Age Distribution for Developers
- —Most developers are aged 18-34 years.
- —For older developers, showing a younger workforce in tech.
📌 Education Level
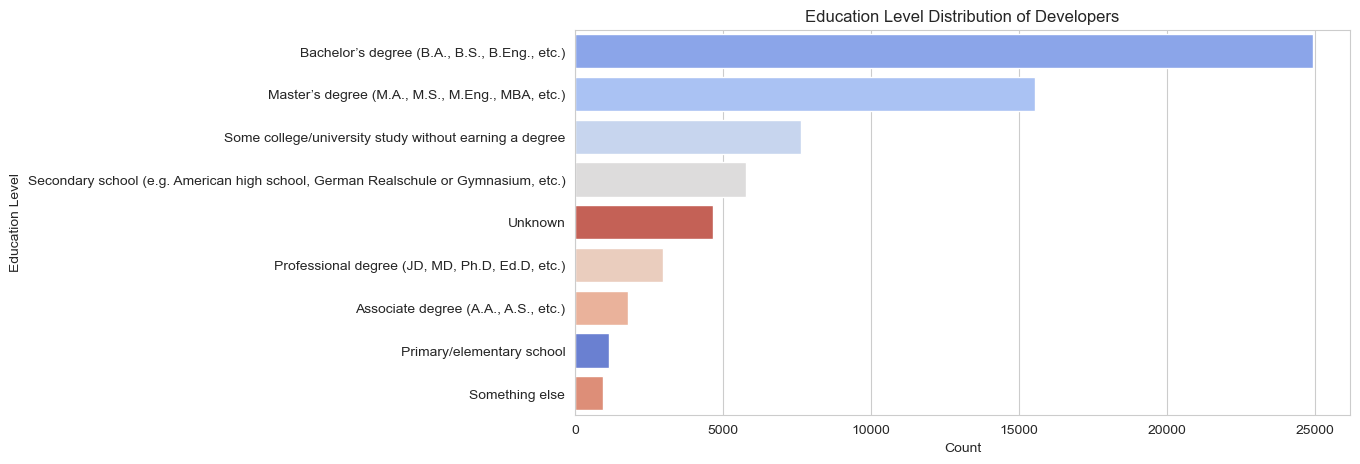
Education Level distribution of Developers
- —Majority hold a Bachelor’s or Master’s degree. 🎓
- —Some self-taught developers & bootcamp graduates.
2️⃣ Popular Programming Languages & Frameworks
📌 Most Used Languages
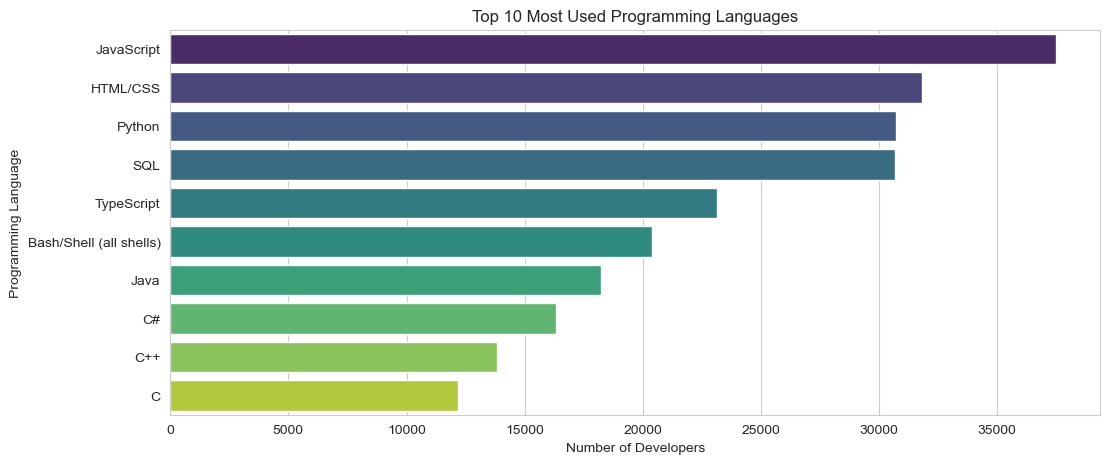
Top 10 Most Used Programming Language
- —Python, JavaScript, and SQL remain the top languages.
- —Rust, Go, and TypeScript are gaining popularity.
📌 Most Wanted Languages
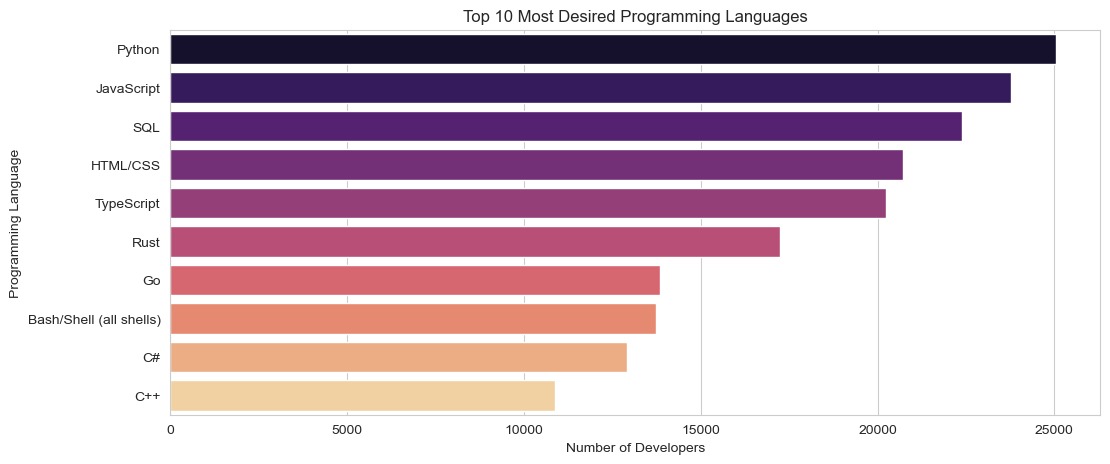
Top 10 most Desired Programming Language
- —Developers want to learn Rust, TypeScript, and Go.
3️⃣ AI Usage & Trust in AI
📌 AI Integration in Development
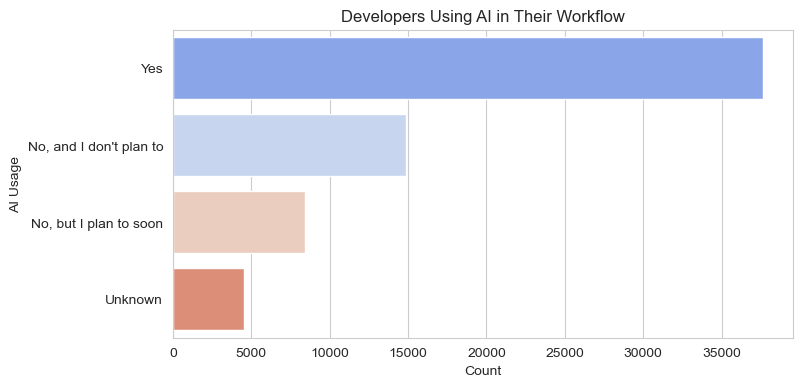
Developers using Ai in their workflow
- —75% of developers use AI-powered tools (ChatGPT, Copilot).
- —Trust in AI varies—some rely on AI, others are sceptical.
- —Some developers worry AI will replace jobs. 🤖💼
4️⃣ Developer Frustrations & Productivity Challenges
📊 Word Cloud of Developer Frustrations
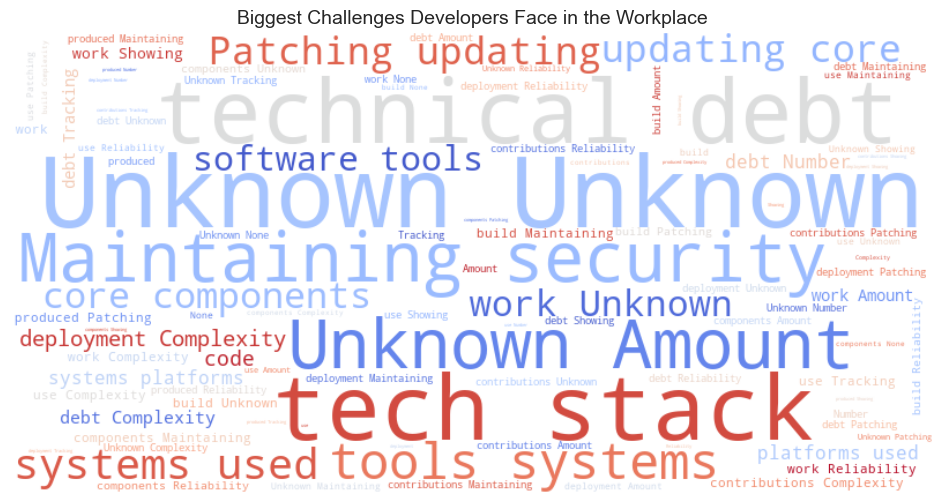
Challenges faced by programmers - Wordcloud
- —"Poor documentation," "tight deadlines," and "legacy code" are common frustrations.
- —Many developers spend 30-60 minutes daily searching for solutions.
5️⃣ Stack Overflow Usage & Learning Trends
📌 How Do Developers Learn?
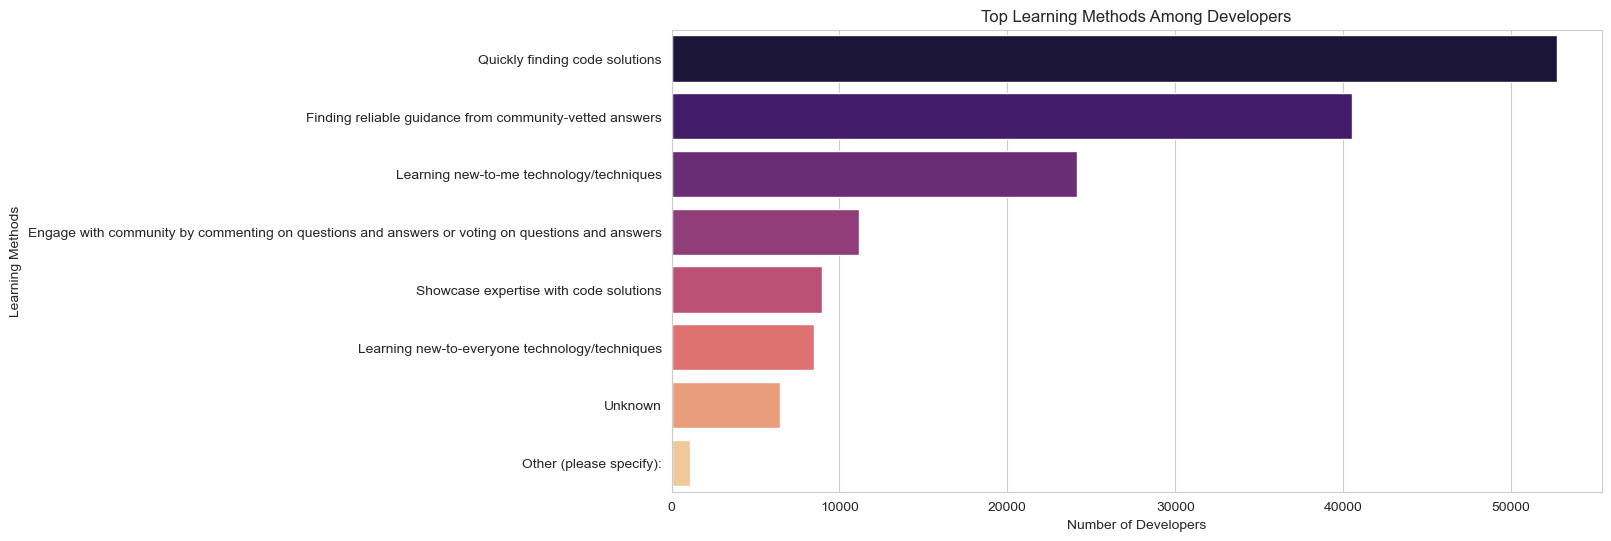
Top Learning Methods Among Developers
- —Most rely on Stack Overflow, online courses, and documentation. 📚
- —AI-powered learning tools are growing in adoption.
📌 How Often Do Developers Visit Stack Overflow?
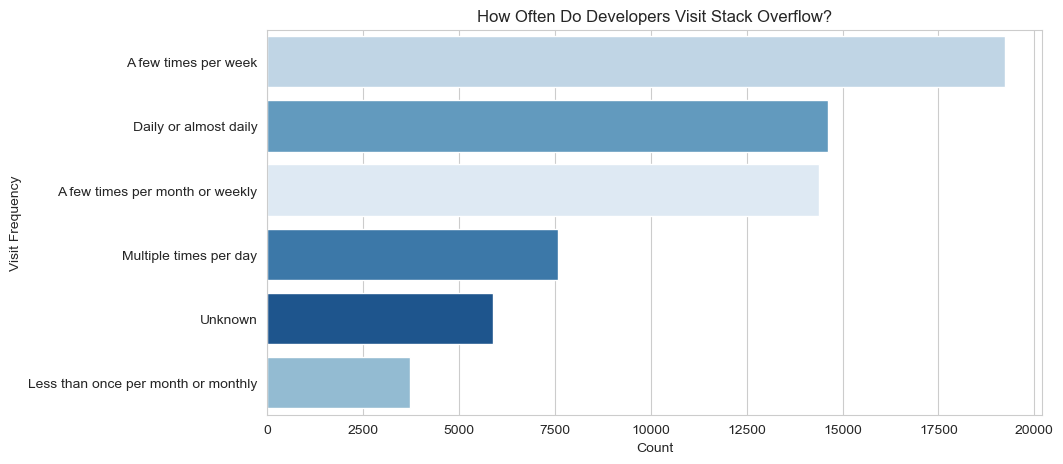
How often do developers visit stack overflow
- —50% visit daily or multiple times per day.
- —Some rely on private documentation instead.
💡 Conclusion & Insights
- —AI is transforming development, but trust in AI remains mixed.
- —Python, JavaScript, and SQL remain dominant, but Rust & TypeScript are the future.
- —Salaries increase with experience but plateau after 20+ years.
- —Developers face major challenges with tight deadlines & outdated code.
- —Stack Overflow & online courses are still essential learning resources.
📌 How to Use This Project?
💻 Requirements
- —Python
- —Jupyter Notebook
- —Libraries: pandas, seaborn, matplotlib, wordcloud
📜 Run the Notebook:
- 1.Clone this repository
- 2.Install required libraries (pip install pandas seaborn matplotlib wordcloud)
- 3.Run jupyter notebook and open the .ipynb file
- 4.Execute the cells to see the analysis
🎯 Next Steps
🔹 Perform machine learning predictions (salary prediction, clustering).
🔹 Use Natural Language Processing (NLP) for sentiment analysis on developer frustrations.
🔹 Compare 2024 data with previous years to identify trends.