Featured Project
FeaturedData ScienceMachine Learning
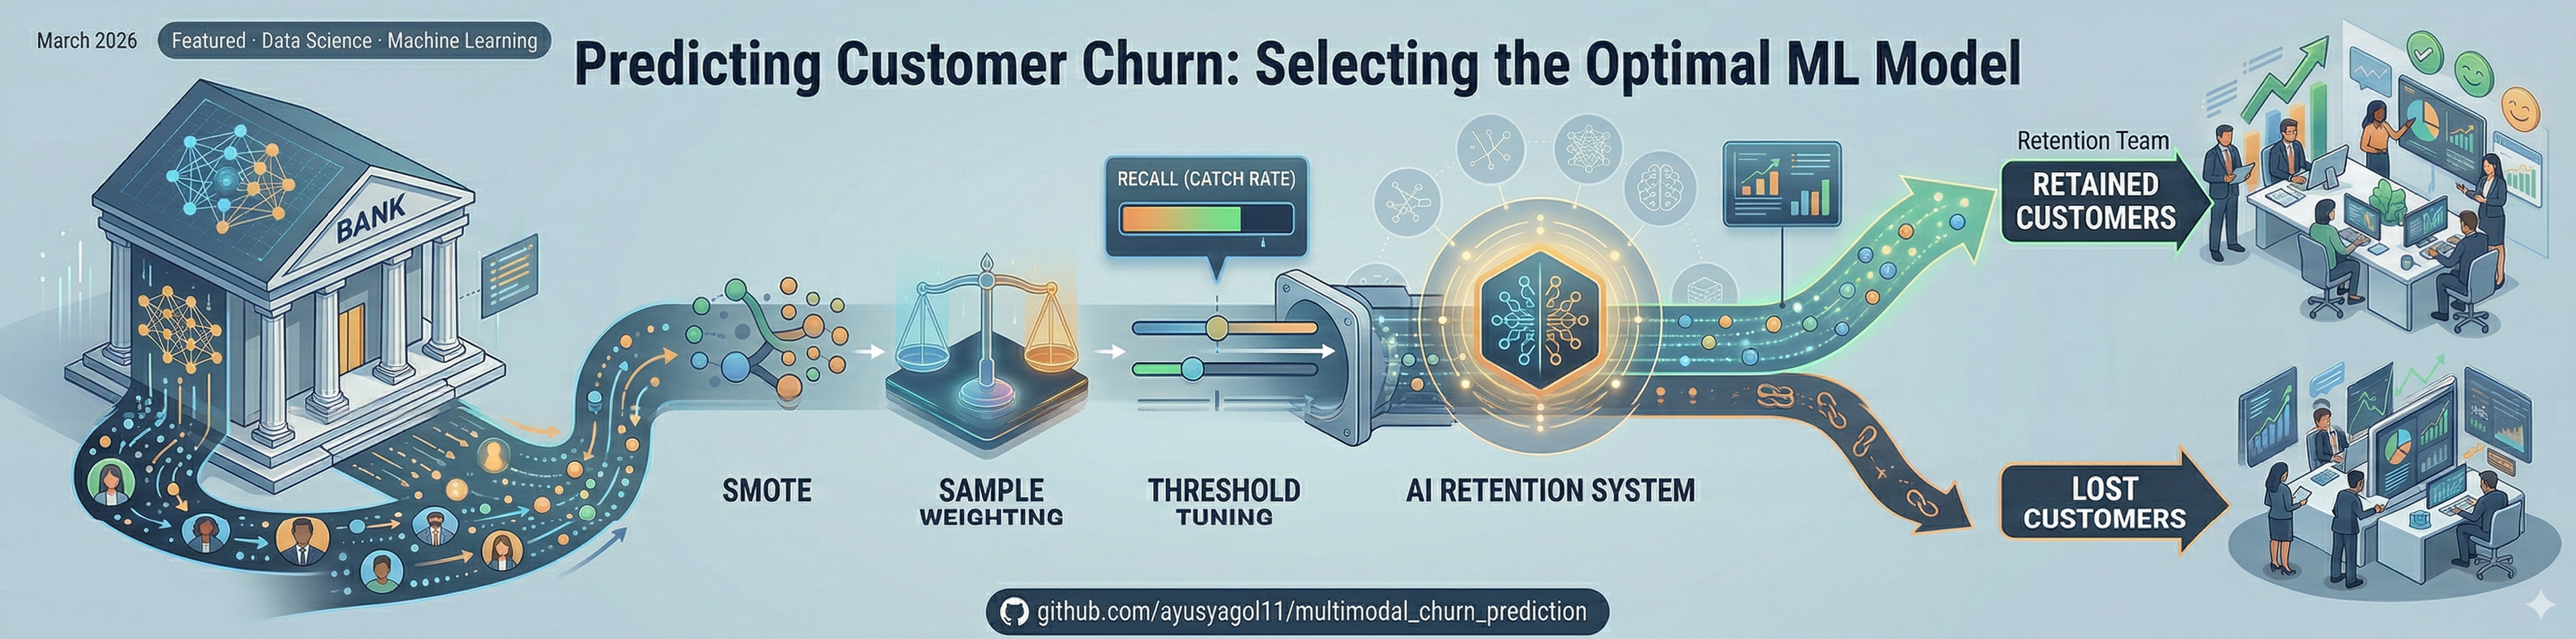
Predicting Customer Churn: Selecting the Optimal ML Model
A six-model machine learning benchmark on 10,000 bank customers — investigating not just which algorithm wins, but how to meaningfully improve recall on a real-world imbalanced dataset using SMOTE, sample weighting, and threshold tuning.
Domain
Banking · Customer Churn
Data Sources
Kaggle
Stack
Python · ML
Published
March 2026
Every year, banks lose billions to customer churn — and most find out a customer has left only after the account closes. This project builds a machine learning early warning system that flags who is likely to leave before they do, giving a retention team time to act.
Six algorithms were tested. Three techniques were applied to push recall beyond the baseline. The result is an honest, end-to-end analysis of what works, what doesn't, and why — including where the model still falls short.
Business Problem & Context
In banking, retaining an existing customer costs 5–7× less than acquiring a new one. The objective here wasn't just to build a model — it was to give a retention team a reliable, ranked list of customers most likely to leave, early enough to intervene.
Three things the model needed to deliver:
- 1.Predict Risk: Assign each customer a churn probability score they can act on.
- 2.Identify Drivers: Surface which customer attributes actually drive churn — so campaigns target the right behaviours, not just the right names.
- 3.Catch More Churners: Maximise the number of at-risk customers identified before they leave — not just overall accuracy.
The goal: Maximise churn detection. Minimise the cost of missing someone who was about to walk away.
The Dataset & The Hidden Trap
The model was trained on a real-world-structured dataset of 10,000 bank customers from Kaggle, with 14 features including age, balance, credit score, number of products, and active membership status.
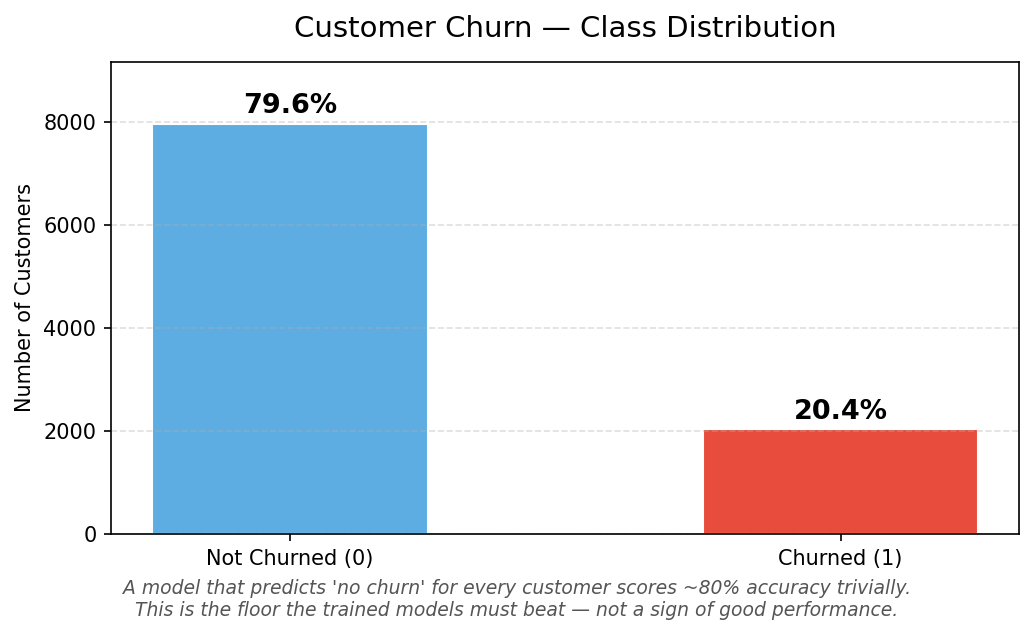
Customer Churn - Class Distribution
The trap most projects fall into: This dataset has a structural imbalance — 79.6% of customers stayed, only 20.4% churned. A model that simply predicts "stays" for every single customer would score 80% accuracy without identifying a single person at risk. Accuracy alone is a completely misleading metric here.
The real measure is recall on churners — of all the customers who actually left, how many did the model catch? That's the number this project was built to maximise.
Methodology & Technical Workflow
1. Data Exploration & Cleaning
No missing values or duplicates. Administrative fields (CustomerID, Surname) were dropped — they carry no predictive signal and would introduce noise.
2. Preprocessing
- ——Encoding: Gender and Geography converted to numeric format using Label Encoding and One-Hot Encoding (drop_first=True to avoid multicollinearity).
- ——Feature Scaling: Balance and EstimatedSalary standardised with StandardScaler so large-valued columns don't dominate distance-based models.
- ——Stratified Split: 80/20 train/test split with stratify=y to preserve the 20.4% churn ratio in both sets.
3. Six-Model Benchmark
Five base algorithms were evaluated across a complexity spectrum, plus a Histogram Gradient Boosting variant:
- ——Logistic Regression — linear baseline
- ——SVM (RBF kernel) — non-linear margin optimiser
- ——K-Nearest Neighbors — instance-based learner
- ——Random Forest — parallel ensemble of 100 trees
- ——Gradient Boosting (GBM) — sequential ensemble, each tree corrects its predecessor's errors
- ——Histogram GBM — faster variant, native categorical support
4. Recall Improvement — Three Approaches
After benchmarking, three techniques were applied to push churner recall beyond the 49% baseline:
- ——SMOTE (Synthetic Minority Oversampling): generates synthetic churn examples during training so the model learns the minority class more deeply
- ——Sample Weighting: penalises mistakes on churners more heavily during training — no new data, just a reweighted loss function
- ——Threshold Adjustment: lowers the decision boundary from 0.50 to 0.35, flagging more customers as at-risk without retraining the model
Visual Analysis & Findings
What's Actually Driving Churn?
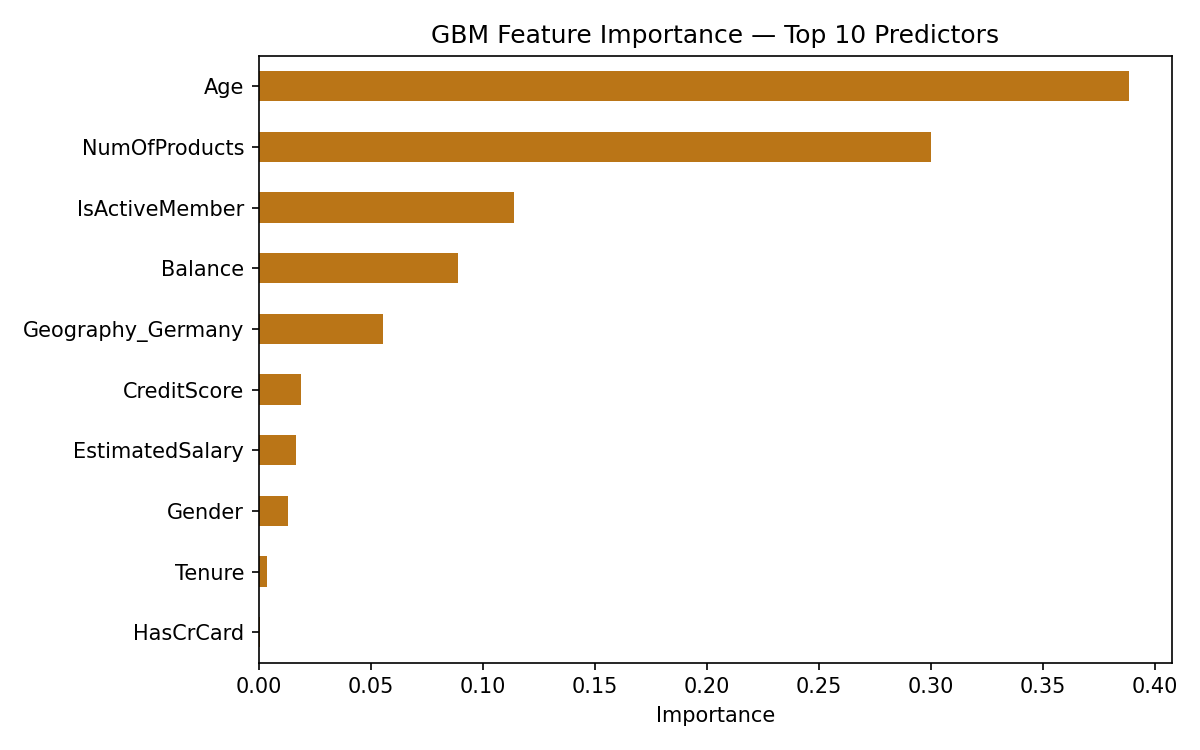
GBM feature importance top 10 predictors
The Gradient Boosting model's feature importance reveals what's actually driving customer exits:
- ——Age dominates. Life stage is the single strongest predictor — older customers churn at significantly higher rates. This is actionable: the bank should investigate what products and touchpoints are failing for older demographics.
- ——Balance is the second driver. Customers with large dormant balances are high-risk — they have assets that could easily move elsewhere.
- ——Number of Products matters. Customers with only one product have far less switching friction than those who hold multiple products with the bank.
- ——Active Membership is a strong signal. Disengaged customers — those not actively using their accounts — are disproportionately likely to leave.
- ——Geography and Gender ranked lowest. For this bank, churn is driven by financial behaviour and life stage, not demographics.
Business insight: A retention campaign targeting inactive single-product customers in older age brackets, particularly those with growing dormant balances, is directly derivable from this analysis. These aren't just model outputs — they're campaign briefs.
How the Six Models Compare
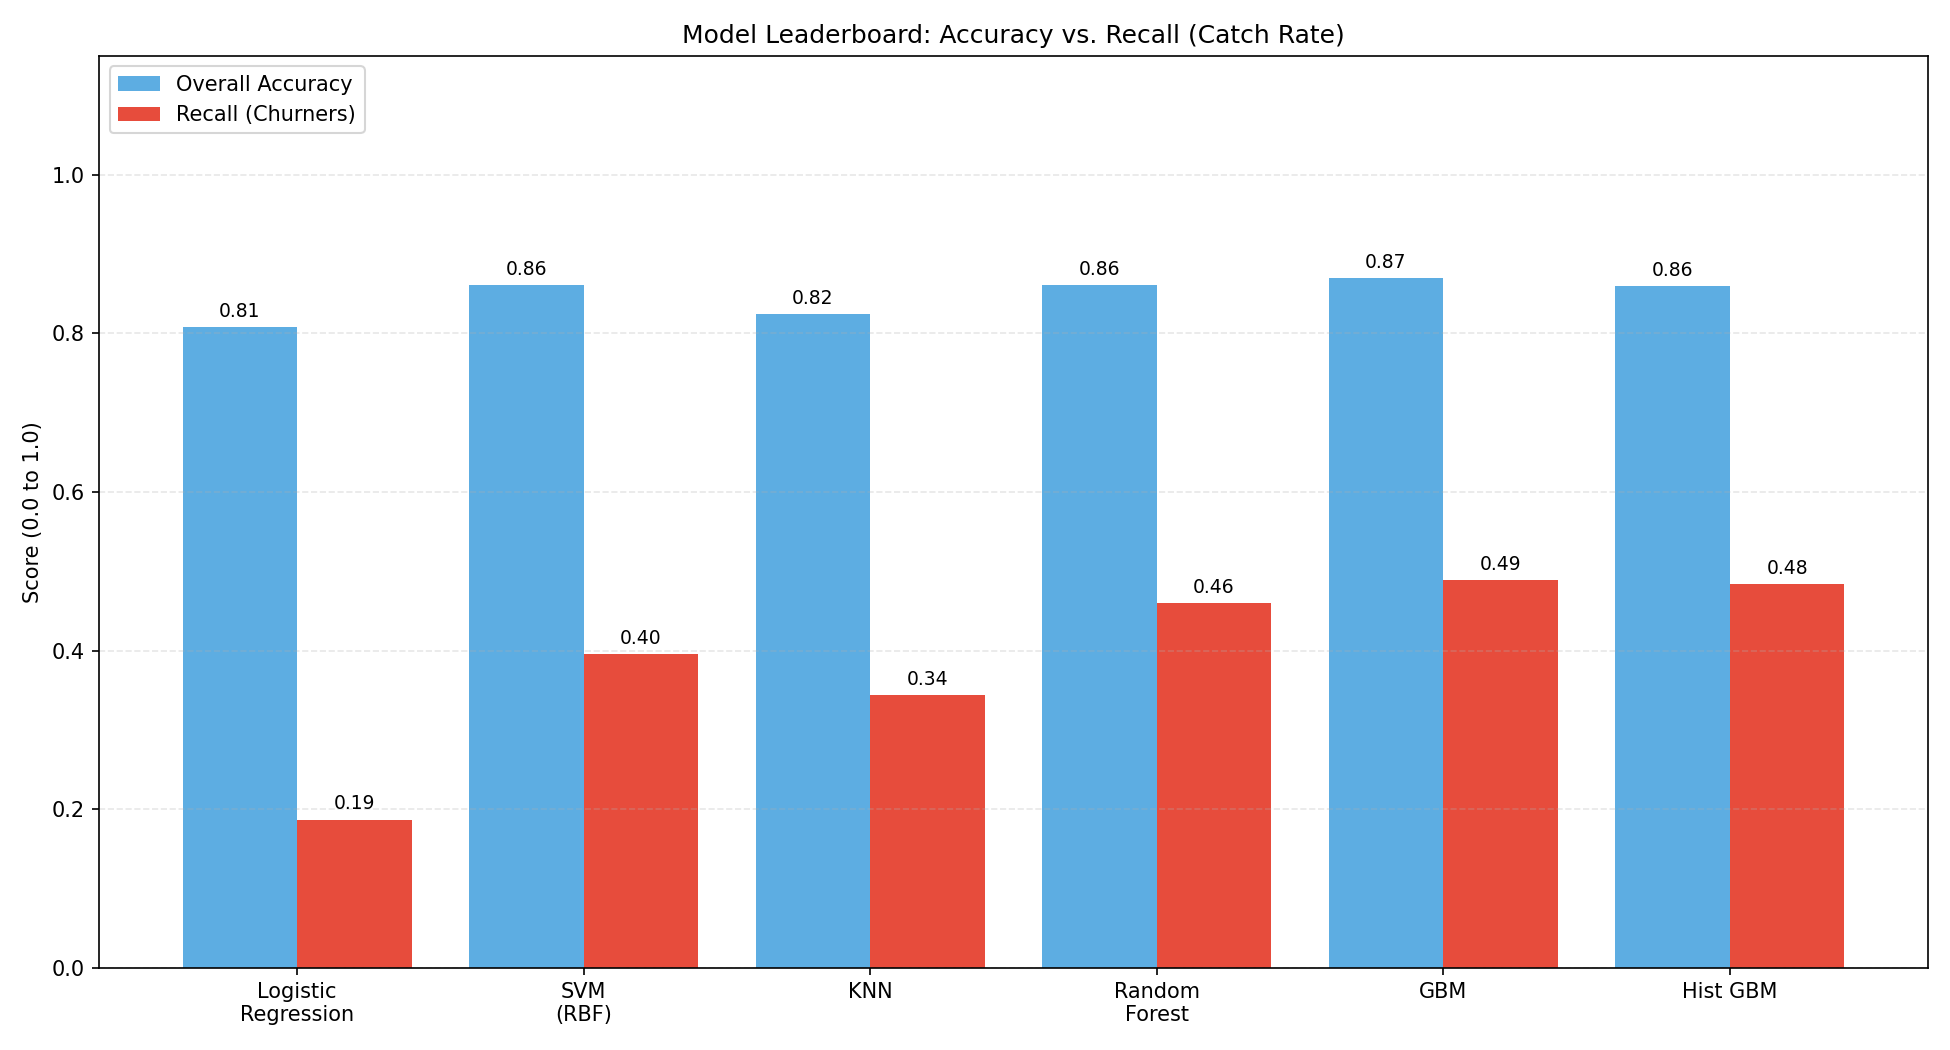
Model Leaderboard: Accuracy Vs Recall Catch Rate
The leaderboard exposes the accuracy trap clearly. Every model scores between 80–87% accuracy — the spread looks narrow. But recall on churners tells a completely different story, ranging from 19% (Logistic Regression) to 49% (GBM).
Gradient Boosting wins the baseline benchmark — not because it has the highest accuracy, but because it catches the most churners. Complex, sequential tree-building allowed it to capture the non-linear patterns that simpler models like Logistic Regression and SVM missed entirely.
But 49% recall means the model still missed more than half of the customers who were about to leave. That's the honest baseline — and it's the starting point for the improvement work below.
How Well Does Each Model Discriminate?
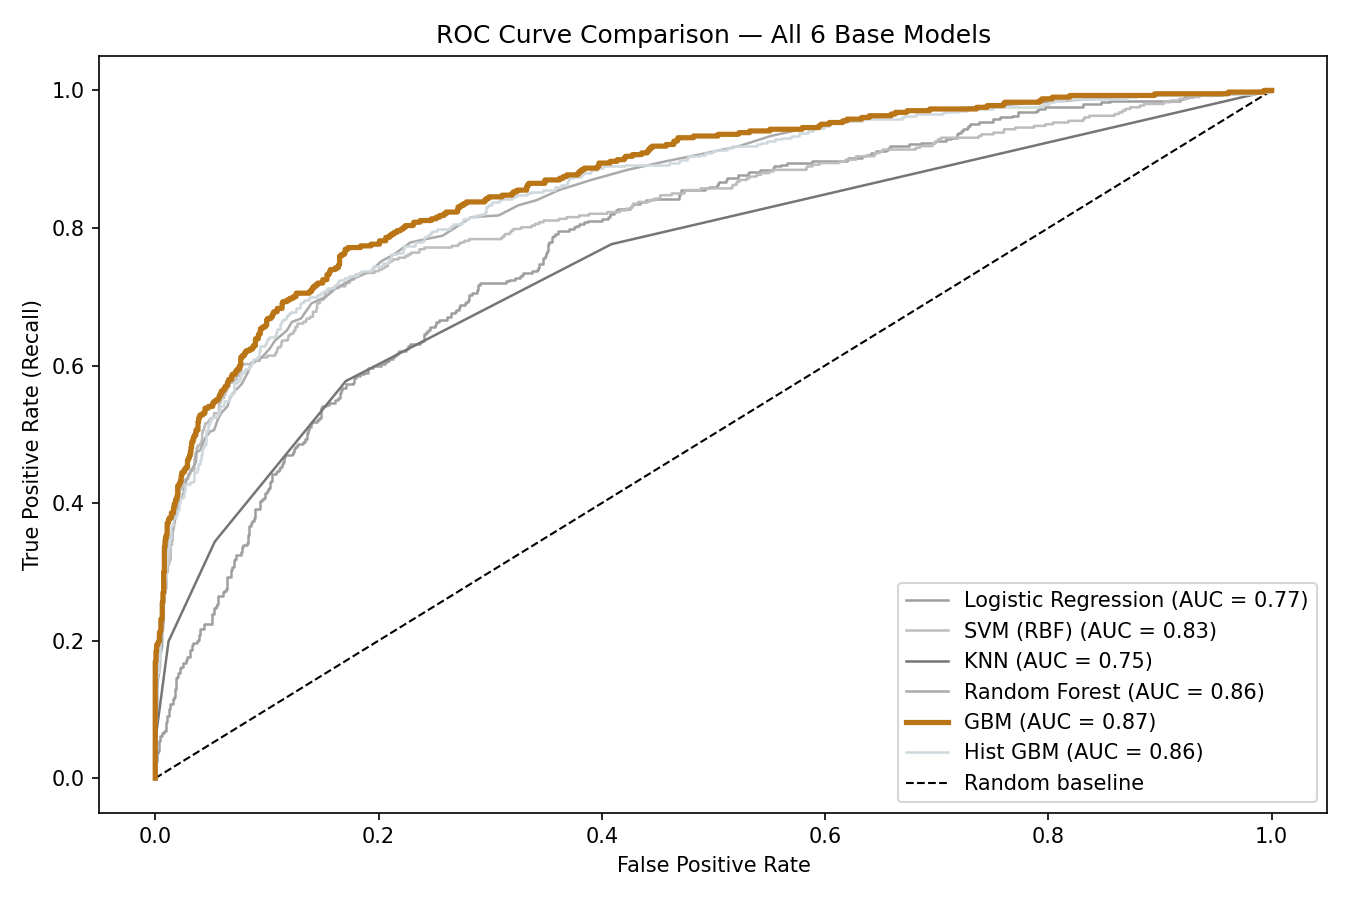
ROC Curve comparison - All 6 Models
The ROC curve measures each model's ability to separate churners from non-churners across every possible decision threshold — not just the default 50% cutoff. An AUC of 1.0 is perfect; 0.5 is random.
GBM leads with an AUC of 0.871, meaning it correctly ranks a churner above a non-churner 87% of the time. This confirms that the model has genuine discriminative power — the 49% recall limitation isn't a fundamental weakness of the model, but an artefact of the imbalanced training data and the default decision threshold.
Pushing Beyond the Baseline — Three Recall Improvements
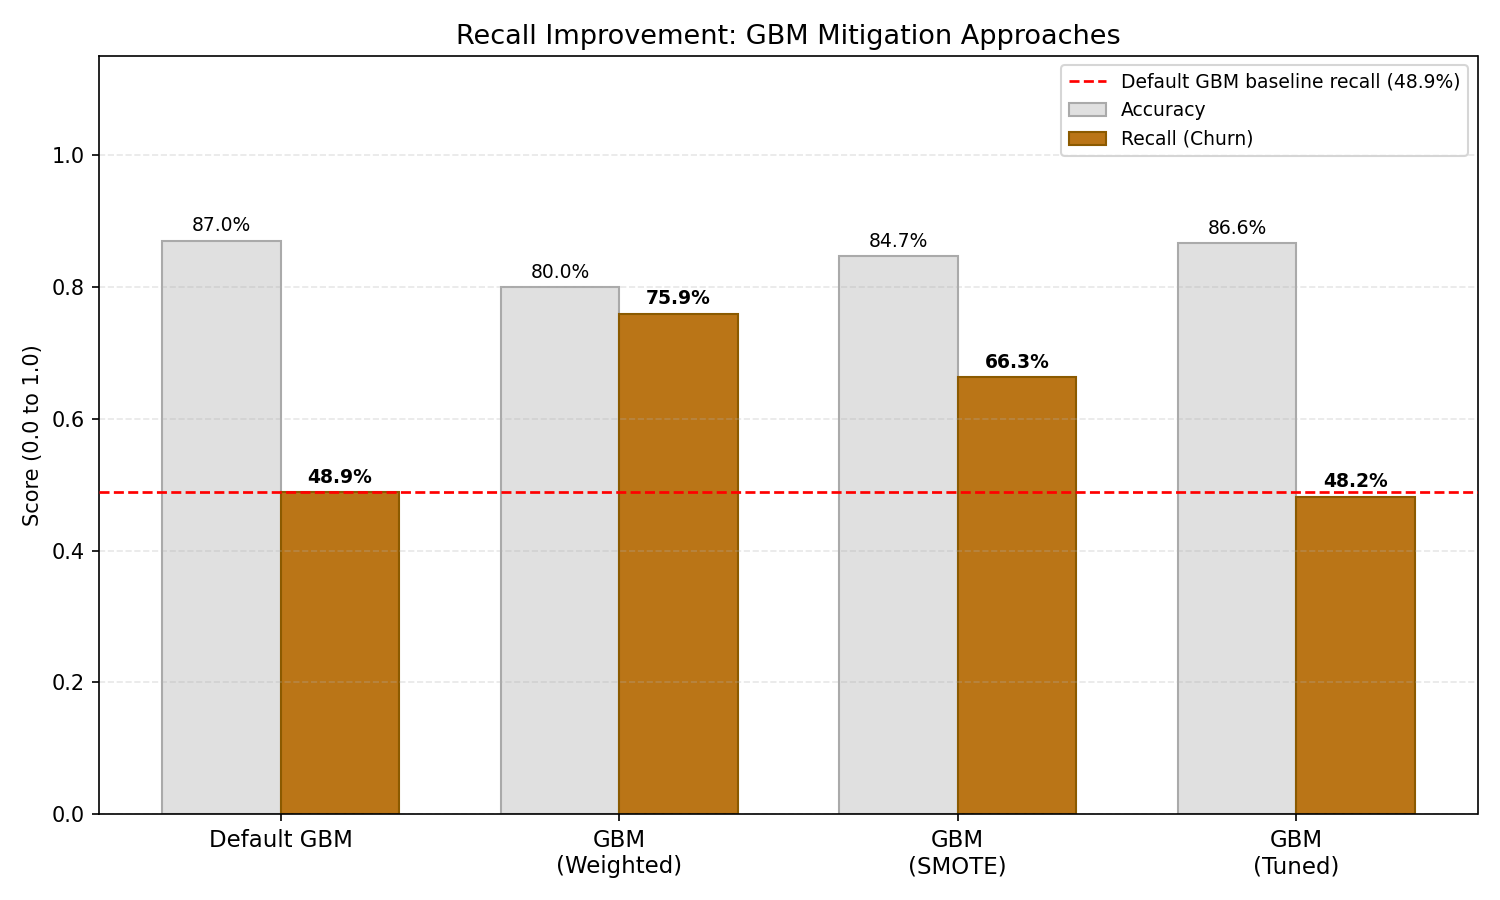
Recall Improvement GBM mitigation approach
All three approaches improved recall meaningfully. Each involves a different tradeoff:
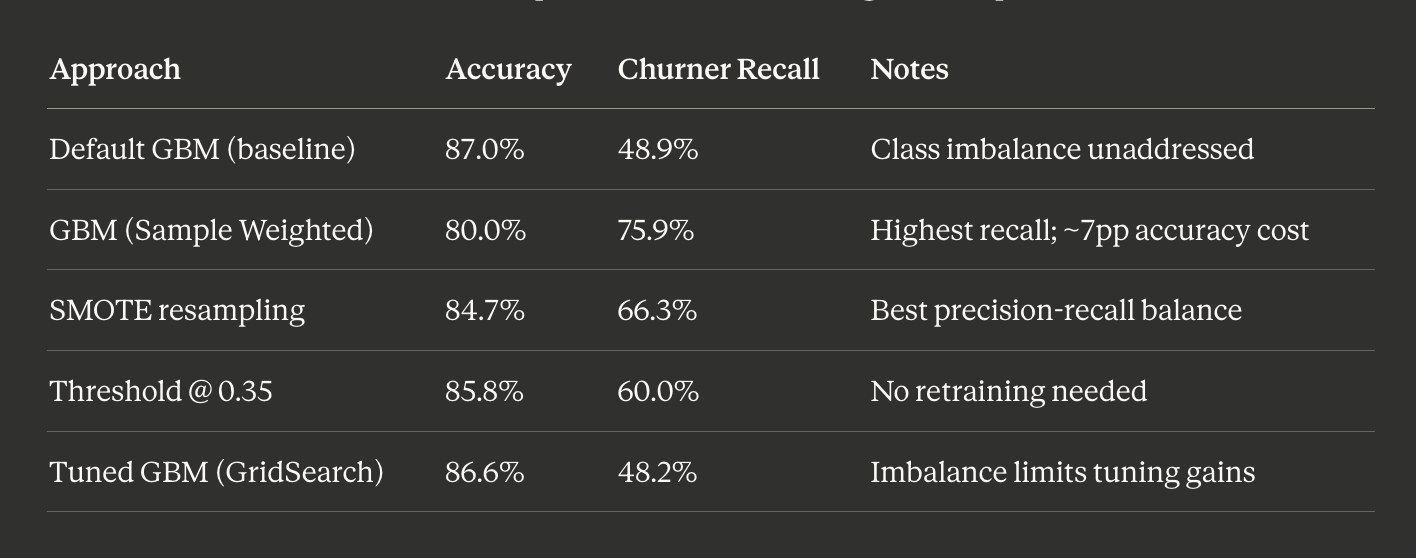
Model Recall improvement Table
Sample weighting produced the largest raw improvement — recall jumped from 48.9% to 75.9%, catching three quarters of all churners. The cost is a ~7 point drop in overall accuracy and a higher false-alarm rate.
SMOTE offers the better operational balance for most retention teams — 66.3% recall with 61.5% precision means the majority of flagged customers are genuine risks.
Which to deploy depends on the business, not the model. A large retention team with budget to contact many customers should use sample weighting. A smaller team needing high-confidence leads should use SMOTE.
The Precision–Recall Tradeoff in Detail
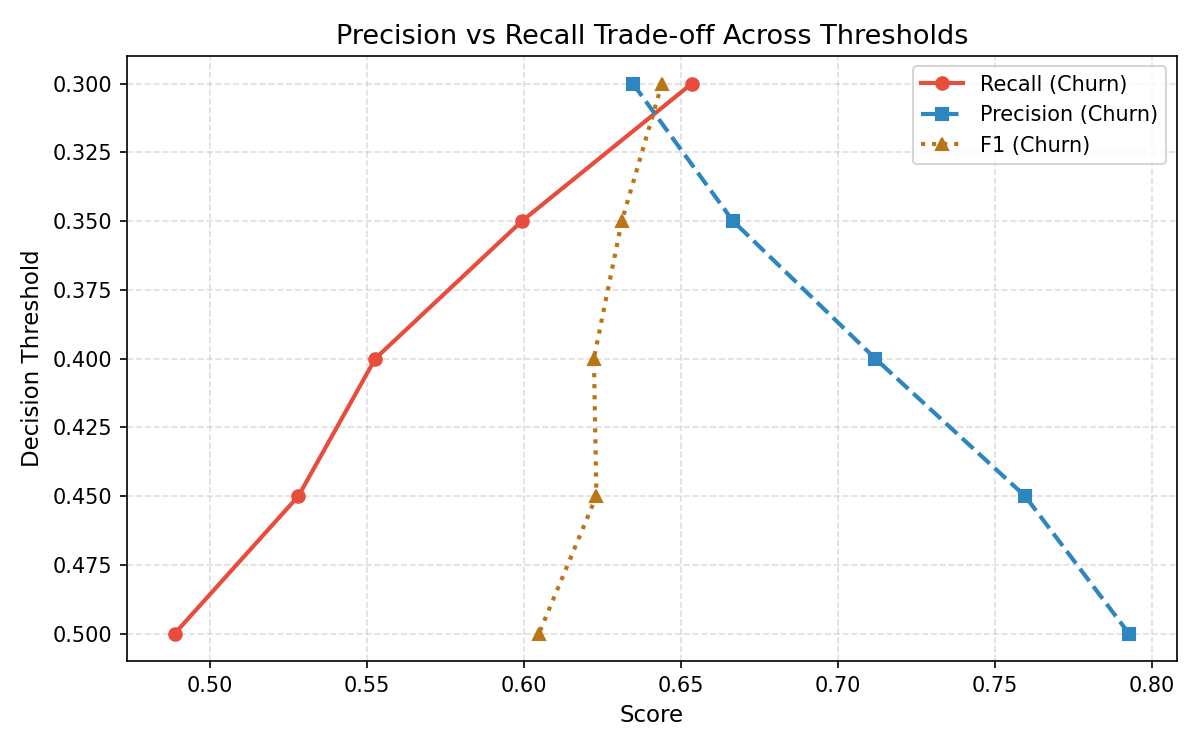
Precision vs Recall Tradeoff across Thresholds
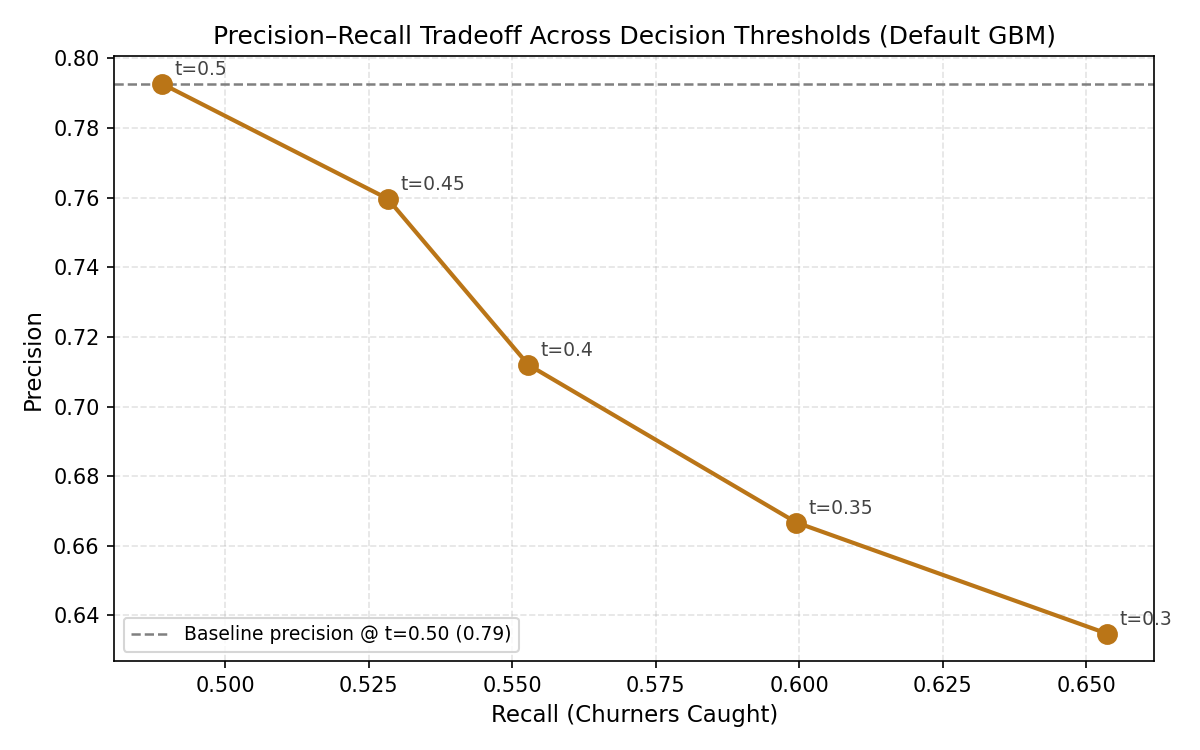
Precision–Recall Tradeoff Scatter — Default GBM
These two charts make the threshold tradeoff explicit and actionable. As the decision boundary lowers, the model catches more churners (recall rises) but also raises more false alarms (precision falls).
The recommended threshold of 0.35 sits at the inflection point — recall improves from 48.9% to 60.0% with a manageable precision reduction. For a bank with a dedicated retention team, this is the lowest-effort, highest-impact change: no retraining, no new data, just a configuration adjustment.
Results Summary
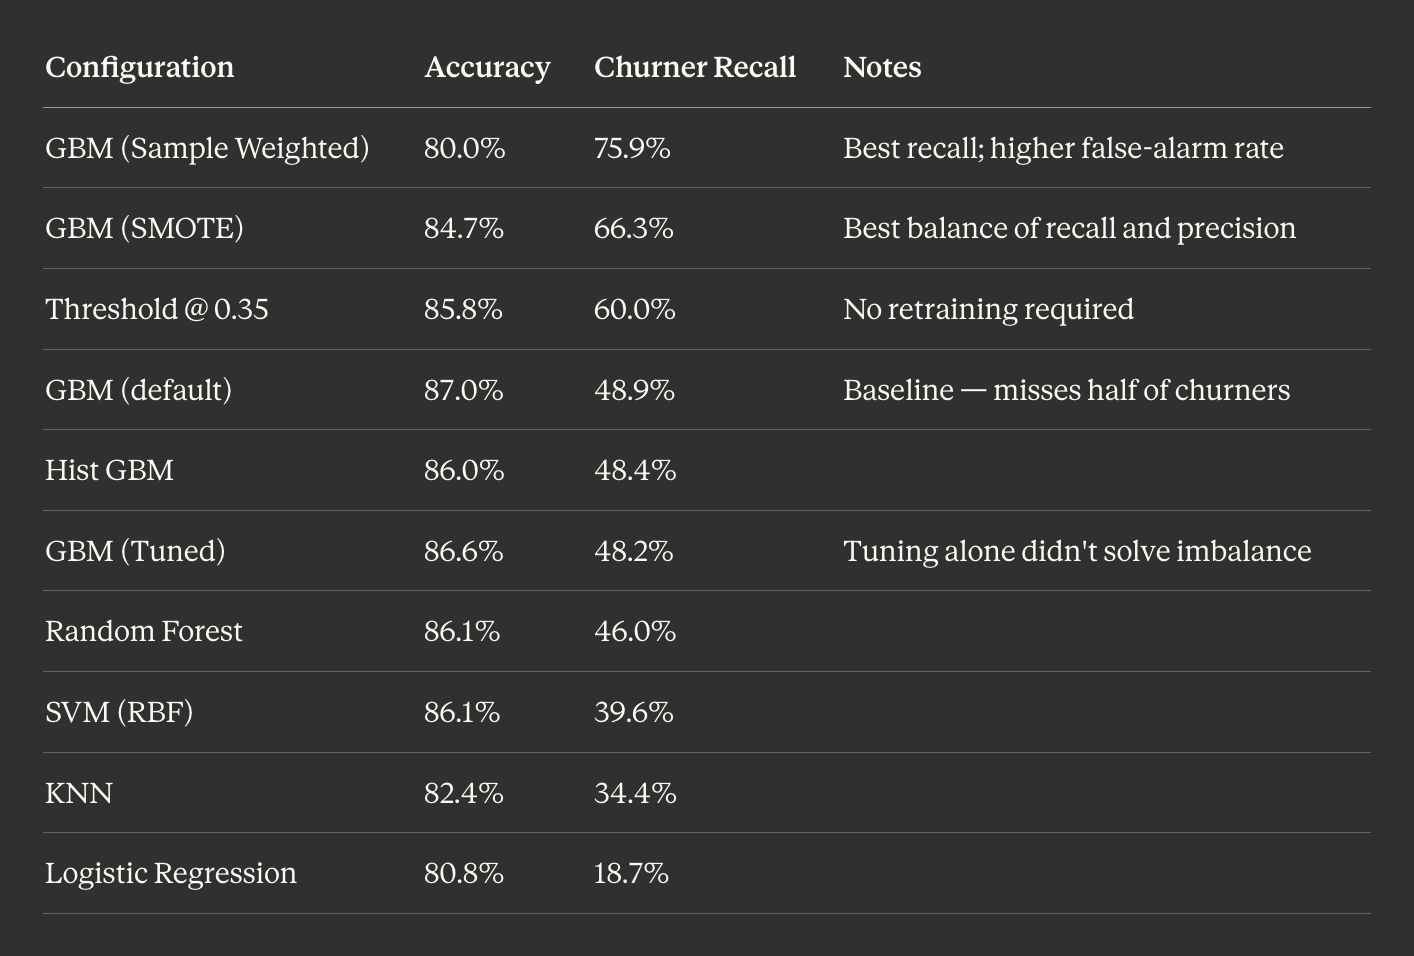
Results Summary Table
Tools & Technologies
- ——Language: Python
- ——Data Manipulation: Pandas, NumPy
- ——Visualisation: Matplotlib, Seaborn
- ——Machine Learning (scikit-learn): Logistic Regression, SVC, KNeighborsClassifier, RandomForestClassifier, GradientBoostingClassifier, HistGradientBoostingClassifier
- ——Imbalance Handling: imbalanced-learn (SMOTE)
- ——Evaluation Metrics: classification_report, roc_auc_score, confusion_matrix, GridSearchCV
Honest Limitations
No project should end without naming what it doesn't do well:
- ——Dataset: This is a widely-used Kaggle benchmark. The methodology is transferable; the specific numbers are illustrative, not production-ready.
- ——Feature depth: 11 features is thin for a production churn model. Transaction recency, product usage frequency, and service interaction history would add substantially more predictive signal.
- ——No temporal modelling: Churn unfolds over time. A production model would use rolling windows and time-series features rather than a single customer snapshot.
- ——Cost calibration: The model doesn't yet account for the monetary cost of a missed churner vs. a wasted retention offer. Incorporating P&L weights would make threshold selection a business decision, not a statistical one.