This project demonstrates an end-to-end data analytics workflow, covering data collection, cleaning, exploration, and visualization. The primary objective is to analyze and visualize London's bike-sharing data to extract valuable insights and showcase interactive visualizations using Python and Tableau.
📖 Project Overview
This project demonstrates an end-to-end data analytics workflow, covering data collection, cleaning, exploration, and visualisation. The primary objective is to analyse and visualise London's bike-sharing data to extract valuable insights and showcase interactive visualisations using Python and Tableau.
London bike sharing Dashboard
View Dashboard: Here
🎯 Project Objectives
- Demonstrate proficiency in Python for data analysis.
- Showcase the ability to create dynamic, user-friendly visualisations in Tableau.
- Provide actionable insights through interactive dashboards.
🔍 Insights Targeted
- Objectives:
- Understand the relationship between weather conditions (temperature, wind speed) and bike-sharing usage.
- Analyse seasonal and temporal trends in bike-sharing.
- Identify peak usage periods and influencing factors.
- Derived Insights:
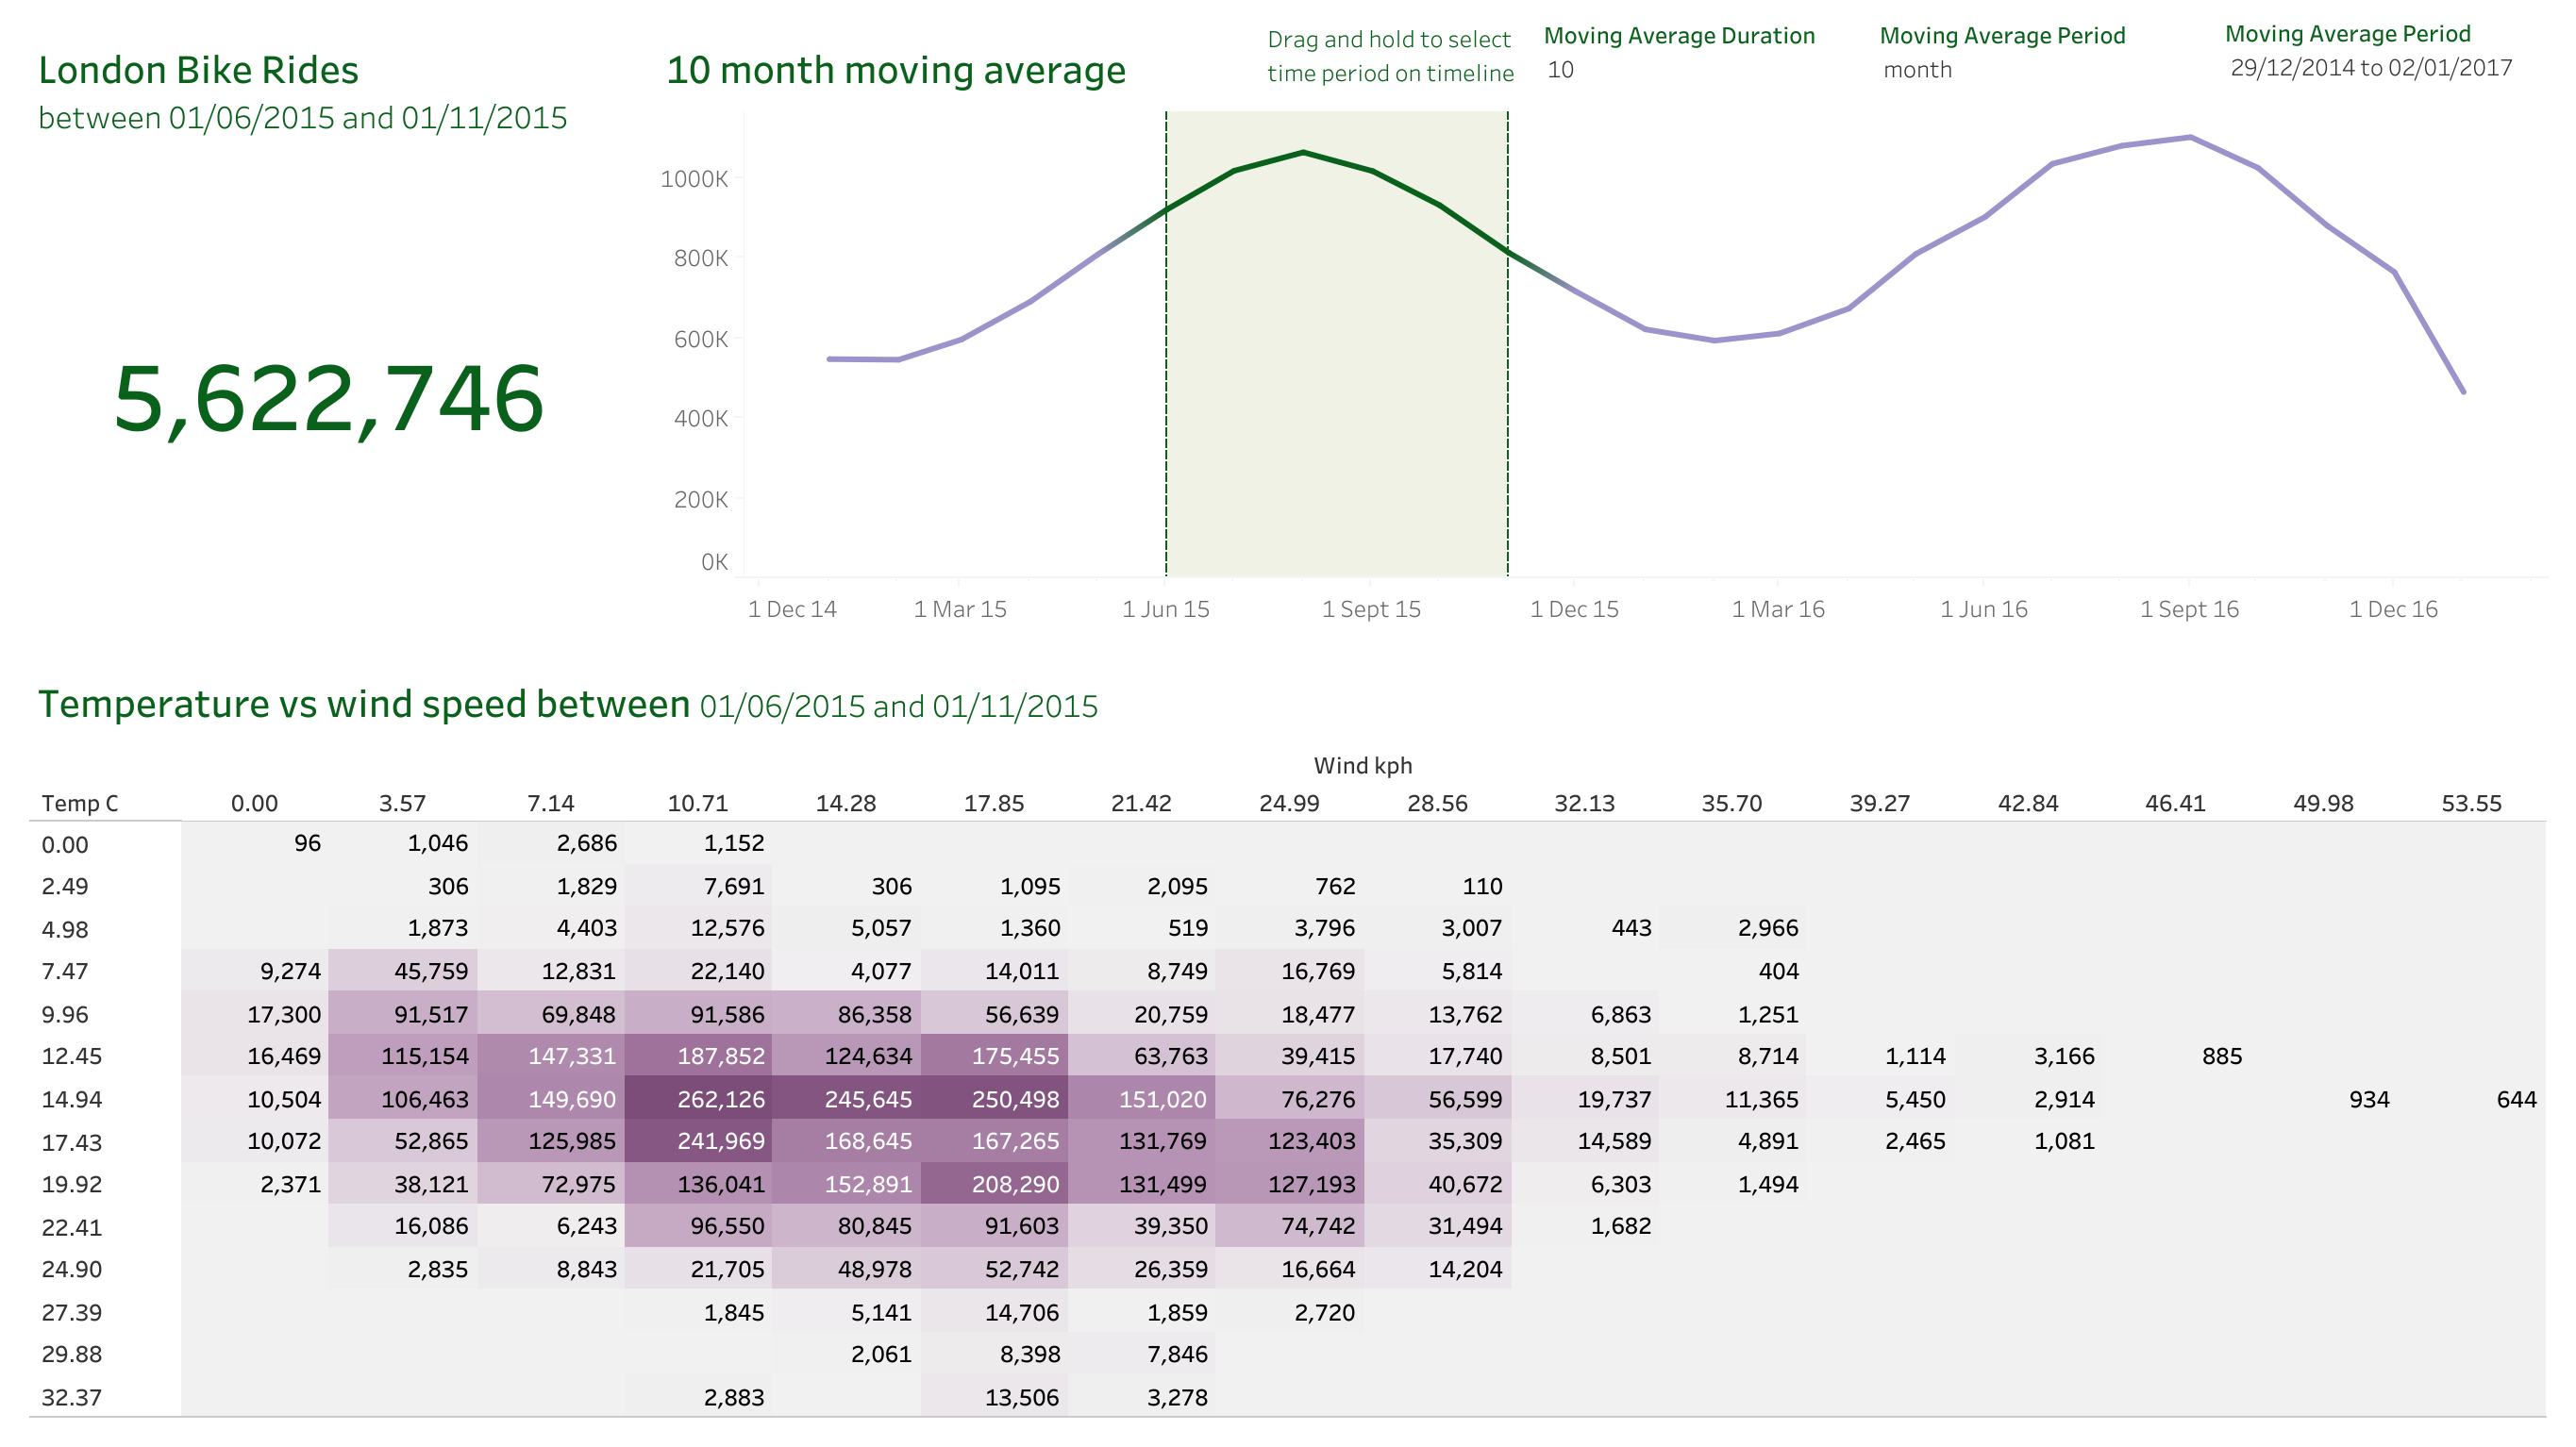
- Higher bike usage corresponds to moderate temperature ranges (approximately 12-20°C).
- Lower wind speeds generally correlate with increased bike usage.
- Usage shows clear seasonal trends, with peak rides occurring during warmer months.
- Dashboard Contribution:
- Interactive filters and dynamic moving average parameters allowed a detailed exploration of temporal trends.
- Heatmap visualisations effectively highlighted relationships between environmental conditions and bike usage.
- Tooltips provided quick contextual insights, breaking down usage by weather and hour, enabling deeper understanding of user behaviour.
🚀 Key Steps Performed
1. Data Collection
- Programmatically downloaded the London bike-sharing dataset from Kaggle using Kaggle API.
2. Data Exploration and Cleaning
- Loaded and inspected data using pandas.
- Renamed columns for clarity.
- Converted humidity percentages and mapped numerical codes to descriptive labels.
- Exported the cleaned dataset to Excel for visualisation purposes.
3. Data Visualization and Dashboard
- Created interactive and dynamic visualisations in Tableau, including:
- Moving average analysis with dynamic parameters (days/weeks/months).
- Temperature vs wind speed heatmap.
- Interactive timeline filtering.
- Additional insights in tooltips (bike rides segmented by weather and hour).
🛠️ Tools and Technologies
- Python: Data extraction and cleaning (pandas, Kaggle API)
- Tableau: Data visualization, dashboard creation, interactivity (calculated fields, parameters, set actions)
- Jupyter Notebook: Code development and documentation
📂 Project Files
london-bike-sharing-dataset.zip: Original dataset downloaded from Kaggle.london_bike_sharing.ipynb: Python notebook containing data extraction, cleaning, and preprocessing using pandas.london_bikes_final.xlsx: Cleaned and processed dataset ready for visualisation.London_Bike_Sharing.twbx: Tableau workbook with interactive visualisations and dashboards.Dashboard 1.png: Snapshot image of the final Tableau dashboard.