Featured Project
FeaturedPredictiveModelingMachineLearning
Predictive Claims Liability Model: Insurance Risk Oversight
Tweedie regression pipeline estimating Pure Premium across 677k+ motor insurance policies — with reactive Streamlit dashboard, model evaluation, and feature importance analysis.
Domain
Motor Insurance · Third-Party Liability
Data Sources
French Motor Third-Party Liability (freMTPL2)
Stack
Python · Scikit-learn · Streamlit · Plotly · Pandas · Joblib
Published
February 2026

Project Overview
In large-scale insurance environments, accurately forecasting the ultimate cost of a claim at the point of lodgement is a critical operational challenge. This project demonstrates an end-to-end analytical transition from operational claims advising to proactive data science.
By leveraging the freMTPL2 dataset (678,013 French Motor TPL policies), I developed a predictive pipeline to estimate Pure Premium (Total Liability / Exposure) — the actuarially standard measure of expected annual claim cost per policy. The model identifies high-risk segments early in the claim lifecycle, enabling evidence-based reserve setting and targeted intervention.
This project directly reflects the analytical approach I apply in my role as a Claims Advisor at Suncorp Group — where I manage Workers' Compensation claims and understand firsthand how claims data flows through the pipeline from lodgement to resolution.
🔗 View Live Interactive Dashboard
About the Dataset: freMTPL2
- —The foundation of this model is the French Motor Third-Party Liability (TPL) Insurance Claims dataset — a standard benchmark in actuarial modelling research.
Scope: Data collected for 677,991 motor third-party liability policies.
Structure: The data is partitioned into two tables:
- —
freMTPL2freq: Policy-specific risk features (driver age, region, vehicle age, Bonus/Malus score, etc.) and the number of claims recorded. - —
freMTPL2sev: The specific cost (amount) for each individual claim.
Integration: Both tables are linked via a unique Policy ID (IDpol) to create a unified view of frequency and severity. Over 93% of policies have zero claims, making this a classic zero-inflated insurance dataset.
The Business Problem
- —Insurance organisations face "claims leakage" and financial volatility due to reactive reserve setting. Traditional manual reviews are resource-intensive and miss non-obvious correlations in high-volume data.
Strategic Objectives:
- —Early Intervention: Automatically flag high-liability policies at the point of entry for specialised management.
- —Reserve Optimisation: Provide data-driven insights to set accurate financial reserves, ensuring organisational liquidity and regulatory compliance.
- —Regulatory Adherence: Ensure data integrity and reporting standards align with French motor insurance governance frameworks.
Technical Methodology
Addressing Zero-Inflation with Tweedie Regression
Insurance data is inherently "zero-inflated" — the vast majority of policies result in zero claims, while a small fraction result in highly skewed, positive costs.
To solve this, I implemented a Tweedie Regressor (p=1.5), a compound Poisson-Gamma distribution. This approach models claim frequency and severity simultaneously in a single unified framework, providing significantly higher accuracy than standard linear models for insurance pricing. The Tweedie family is the actuarially standard choice for this class of problem.
ML Preprocessing Pipeline
- —End-to-End Pipeline: Modular Scikit-learn pipeline handling automated data acquisition, cleaning, and transformation.
- —Feature Engineering:
ColumnTransformerfor simultaneous numerical scaling (StandardScaler) and categorical encoding (One-Hot Encoding) of 9 risk features. - —Exposure Weighting: Model trained using
Exposureas a sample weight to ensure predictions are proportional to policy duration — critical for annualised premium estimation.
Model Evaluation Results
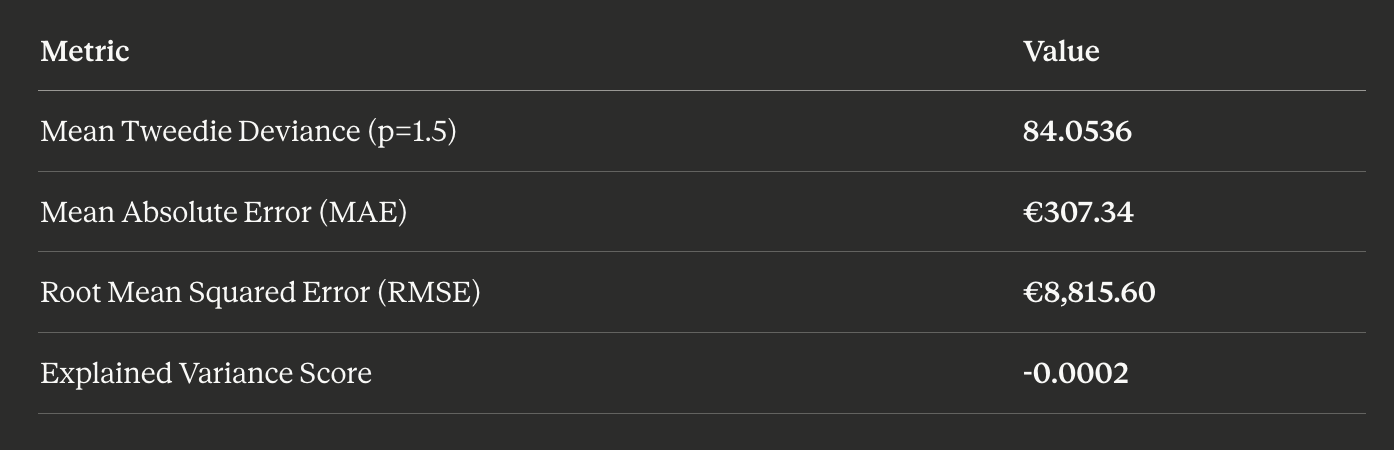
Evaluated on a 20% holdout test set (~135,000 policies):
Model Evaluation Results
Mean Tweedie Deviance is the primary evaluation metric — it is the native loss function for the Tweedie distribution family. Standard R² can be misleading for zero-inflated insurance data.
Why is Explained Variance near zero and MAE high? Over 93% of policies have zero claims, making the actual Pure Premium distribution extremely zero-inflated. The model predicts expected liability (a small positive value for every policy), not whether a specific claim will occur. The MAE (€307) is large relative to the median predicted premium (€117) because most actuals are €0 while predictions are always positive — this is by design in actuarial pricing models, not a deficiency.
Feature Importance Analysis
Permutation importance analysis reveals which features most influence predicted Pure Premium:
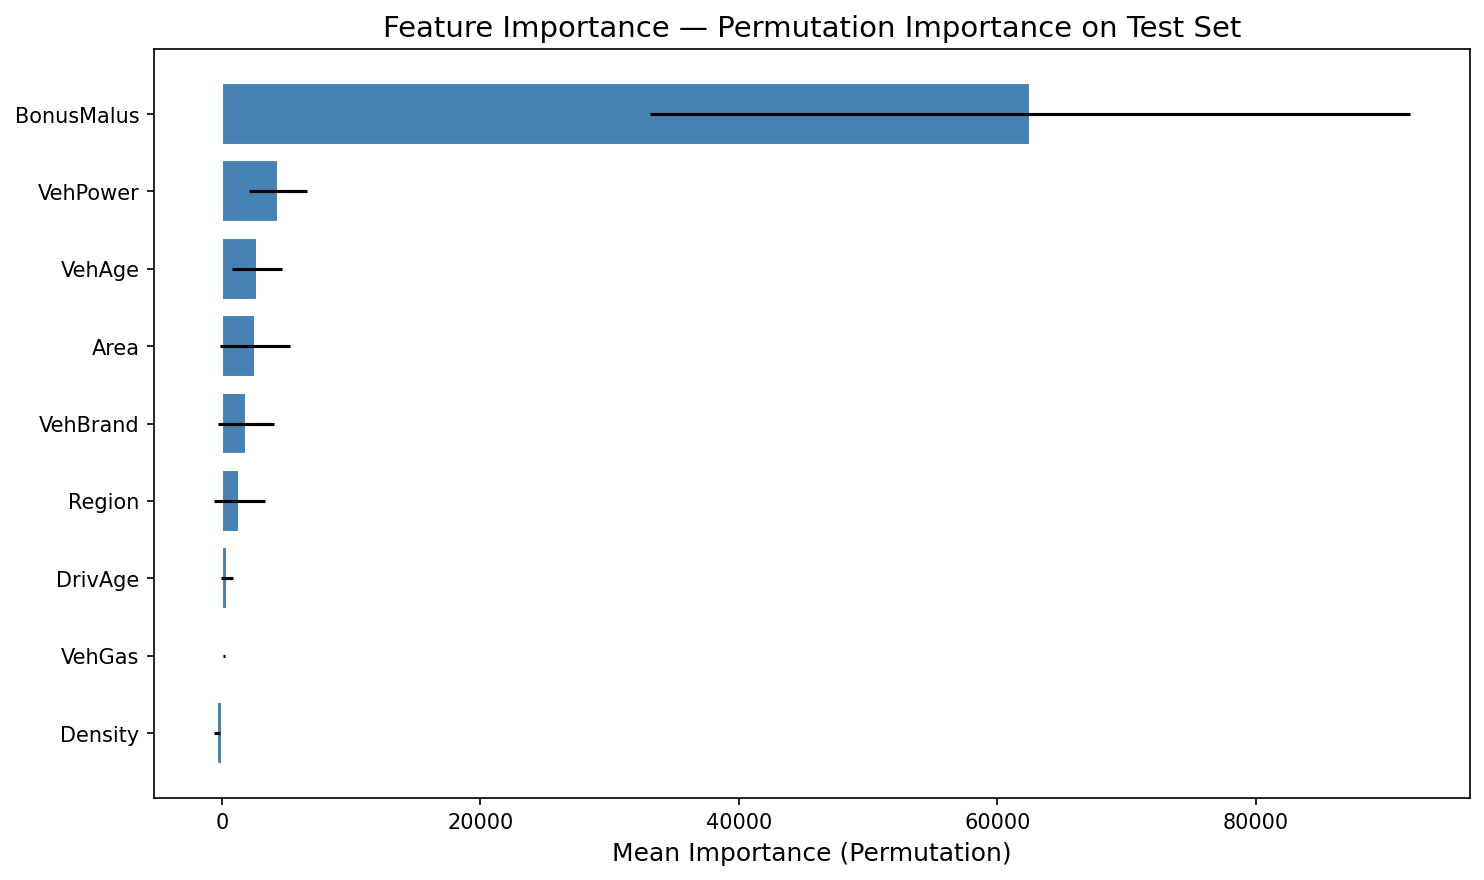
Feature Importance - Permutation Importance on Test Set
BonusMalus (claims history risk index) dominates — this aligns with actuarial expectations. A policyholder's claims history is the single strongest predictor of future liability. Vehicle characteristics (power, age) and geographic factors (area, region) contribute meaningfully but at a much lower magnitude.
This finding has direct business implications: it validates that the French CRM (Coefficient de Réduction-Majoration) system — where premiums are adjusted based on claims history — correctly captures the primary risk signal in the data.
Model Diagnostics
Predicted vs Actual Pure Premium
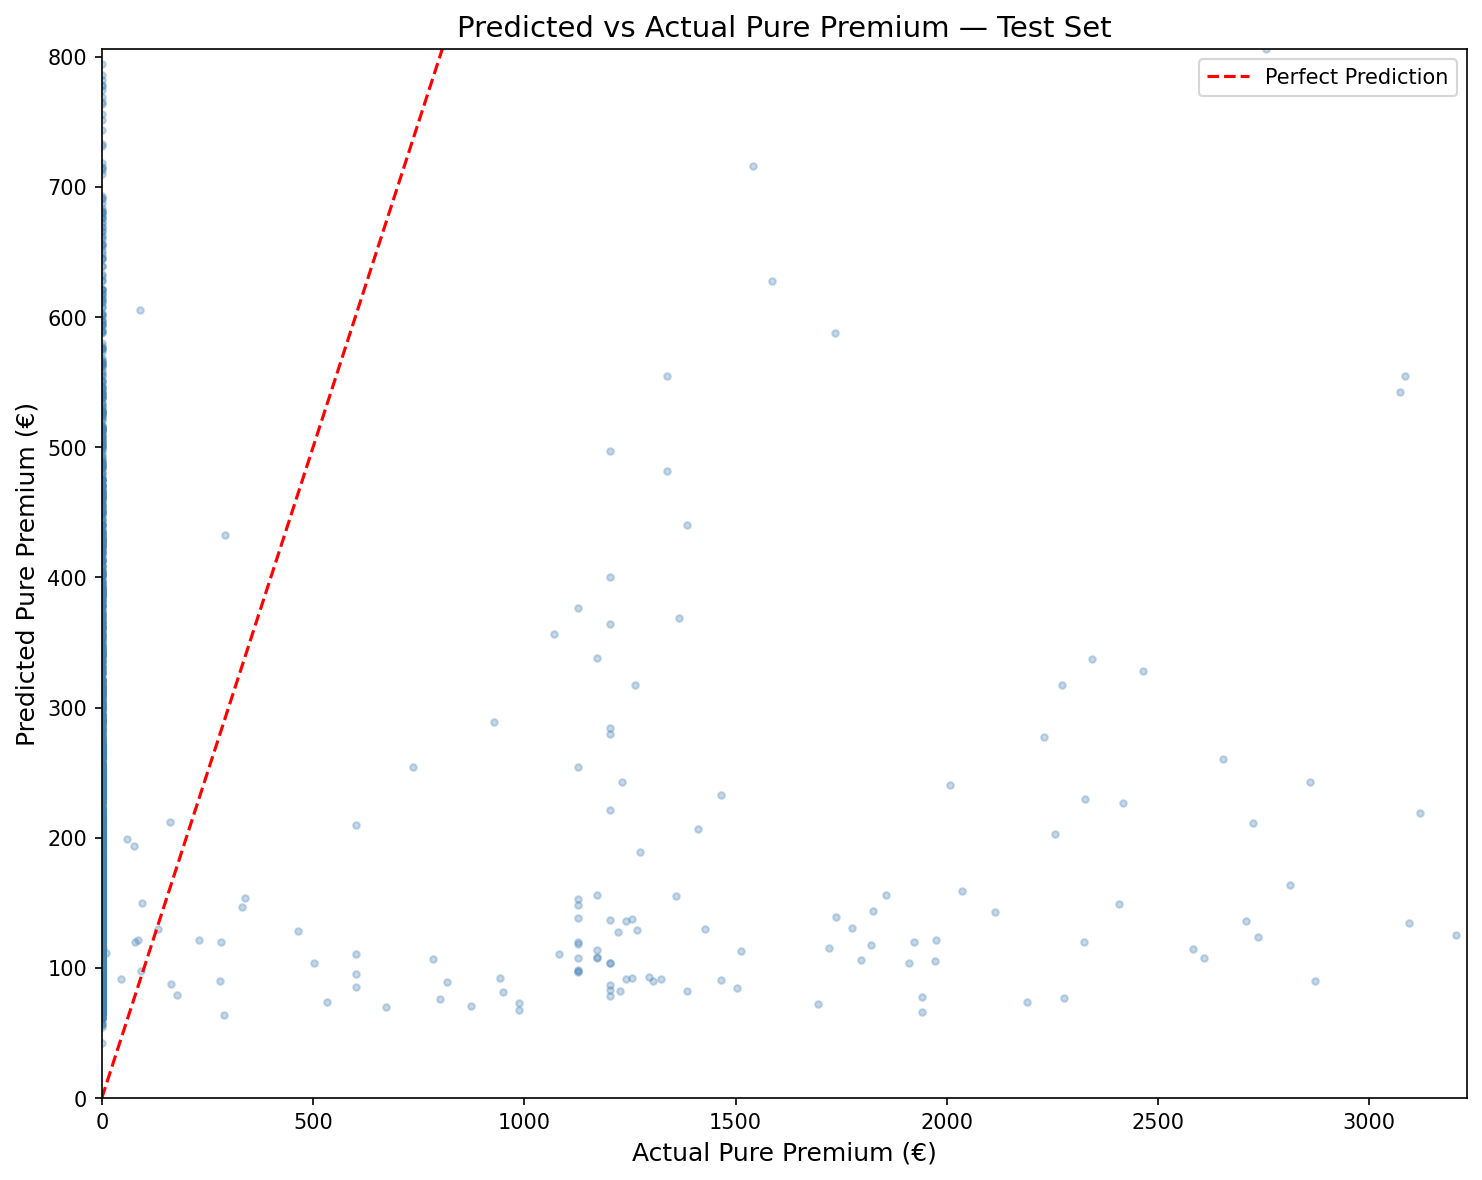
Predicted vs Actual Pure Premium - Test Set
The scatter plot shows the model's predictions against actual Pure Premium values on the test set. Points clustered along the diagonal (red dashed line) indicate accurate predictions. The model captures the general trend well for low-to-moderate claims, though it systematically underpredicts extreme outlier claims — a known limitation of linear Tweedie models on heavy-tailed insurance data.
Distribution of Prediction Residuals
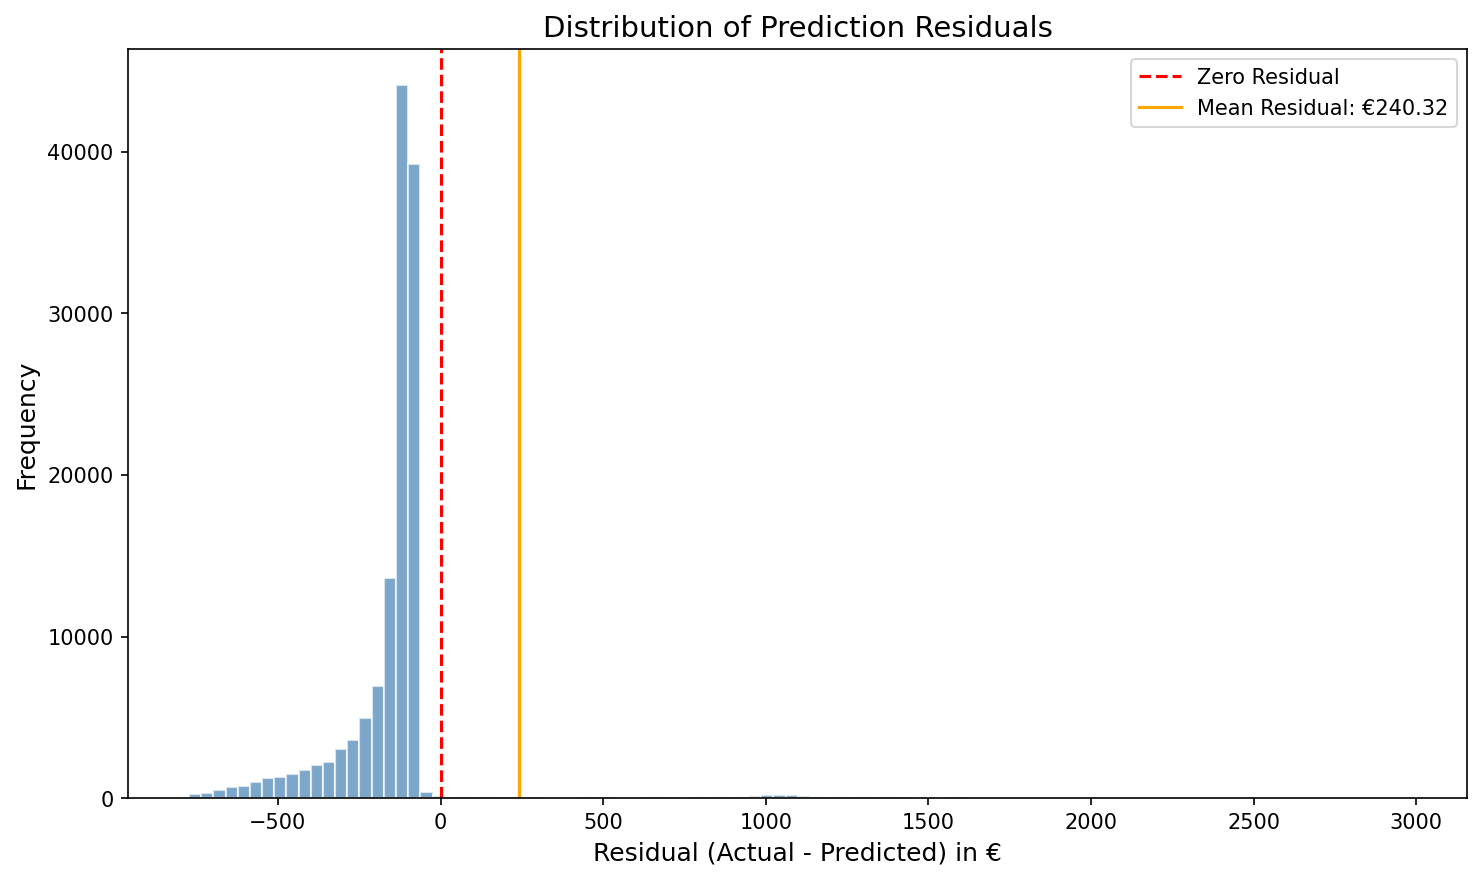
Distribution of Prediction Residuals
The residuals (Actual − Predicted) are heavily right-skewed with a mean of €240.32. The sharp spike near zero reflects the 93% of policies with zero claims where the model's small positive prediction creates a slight negative residual. The long right tail represents the rare high-cost claims that exceed the model's predictions — these are the cases that would trigger the "early intervention" flag in a production deployment.
Live Dashboard
The project includes a deployed Streamlit dashboard enabling non-technical stakeholders to explore individual policy risk profiles interactively.
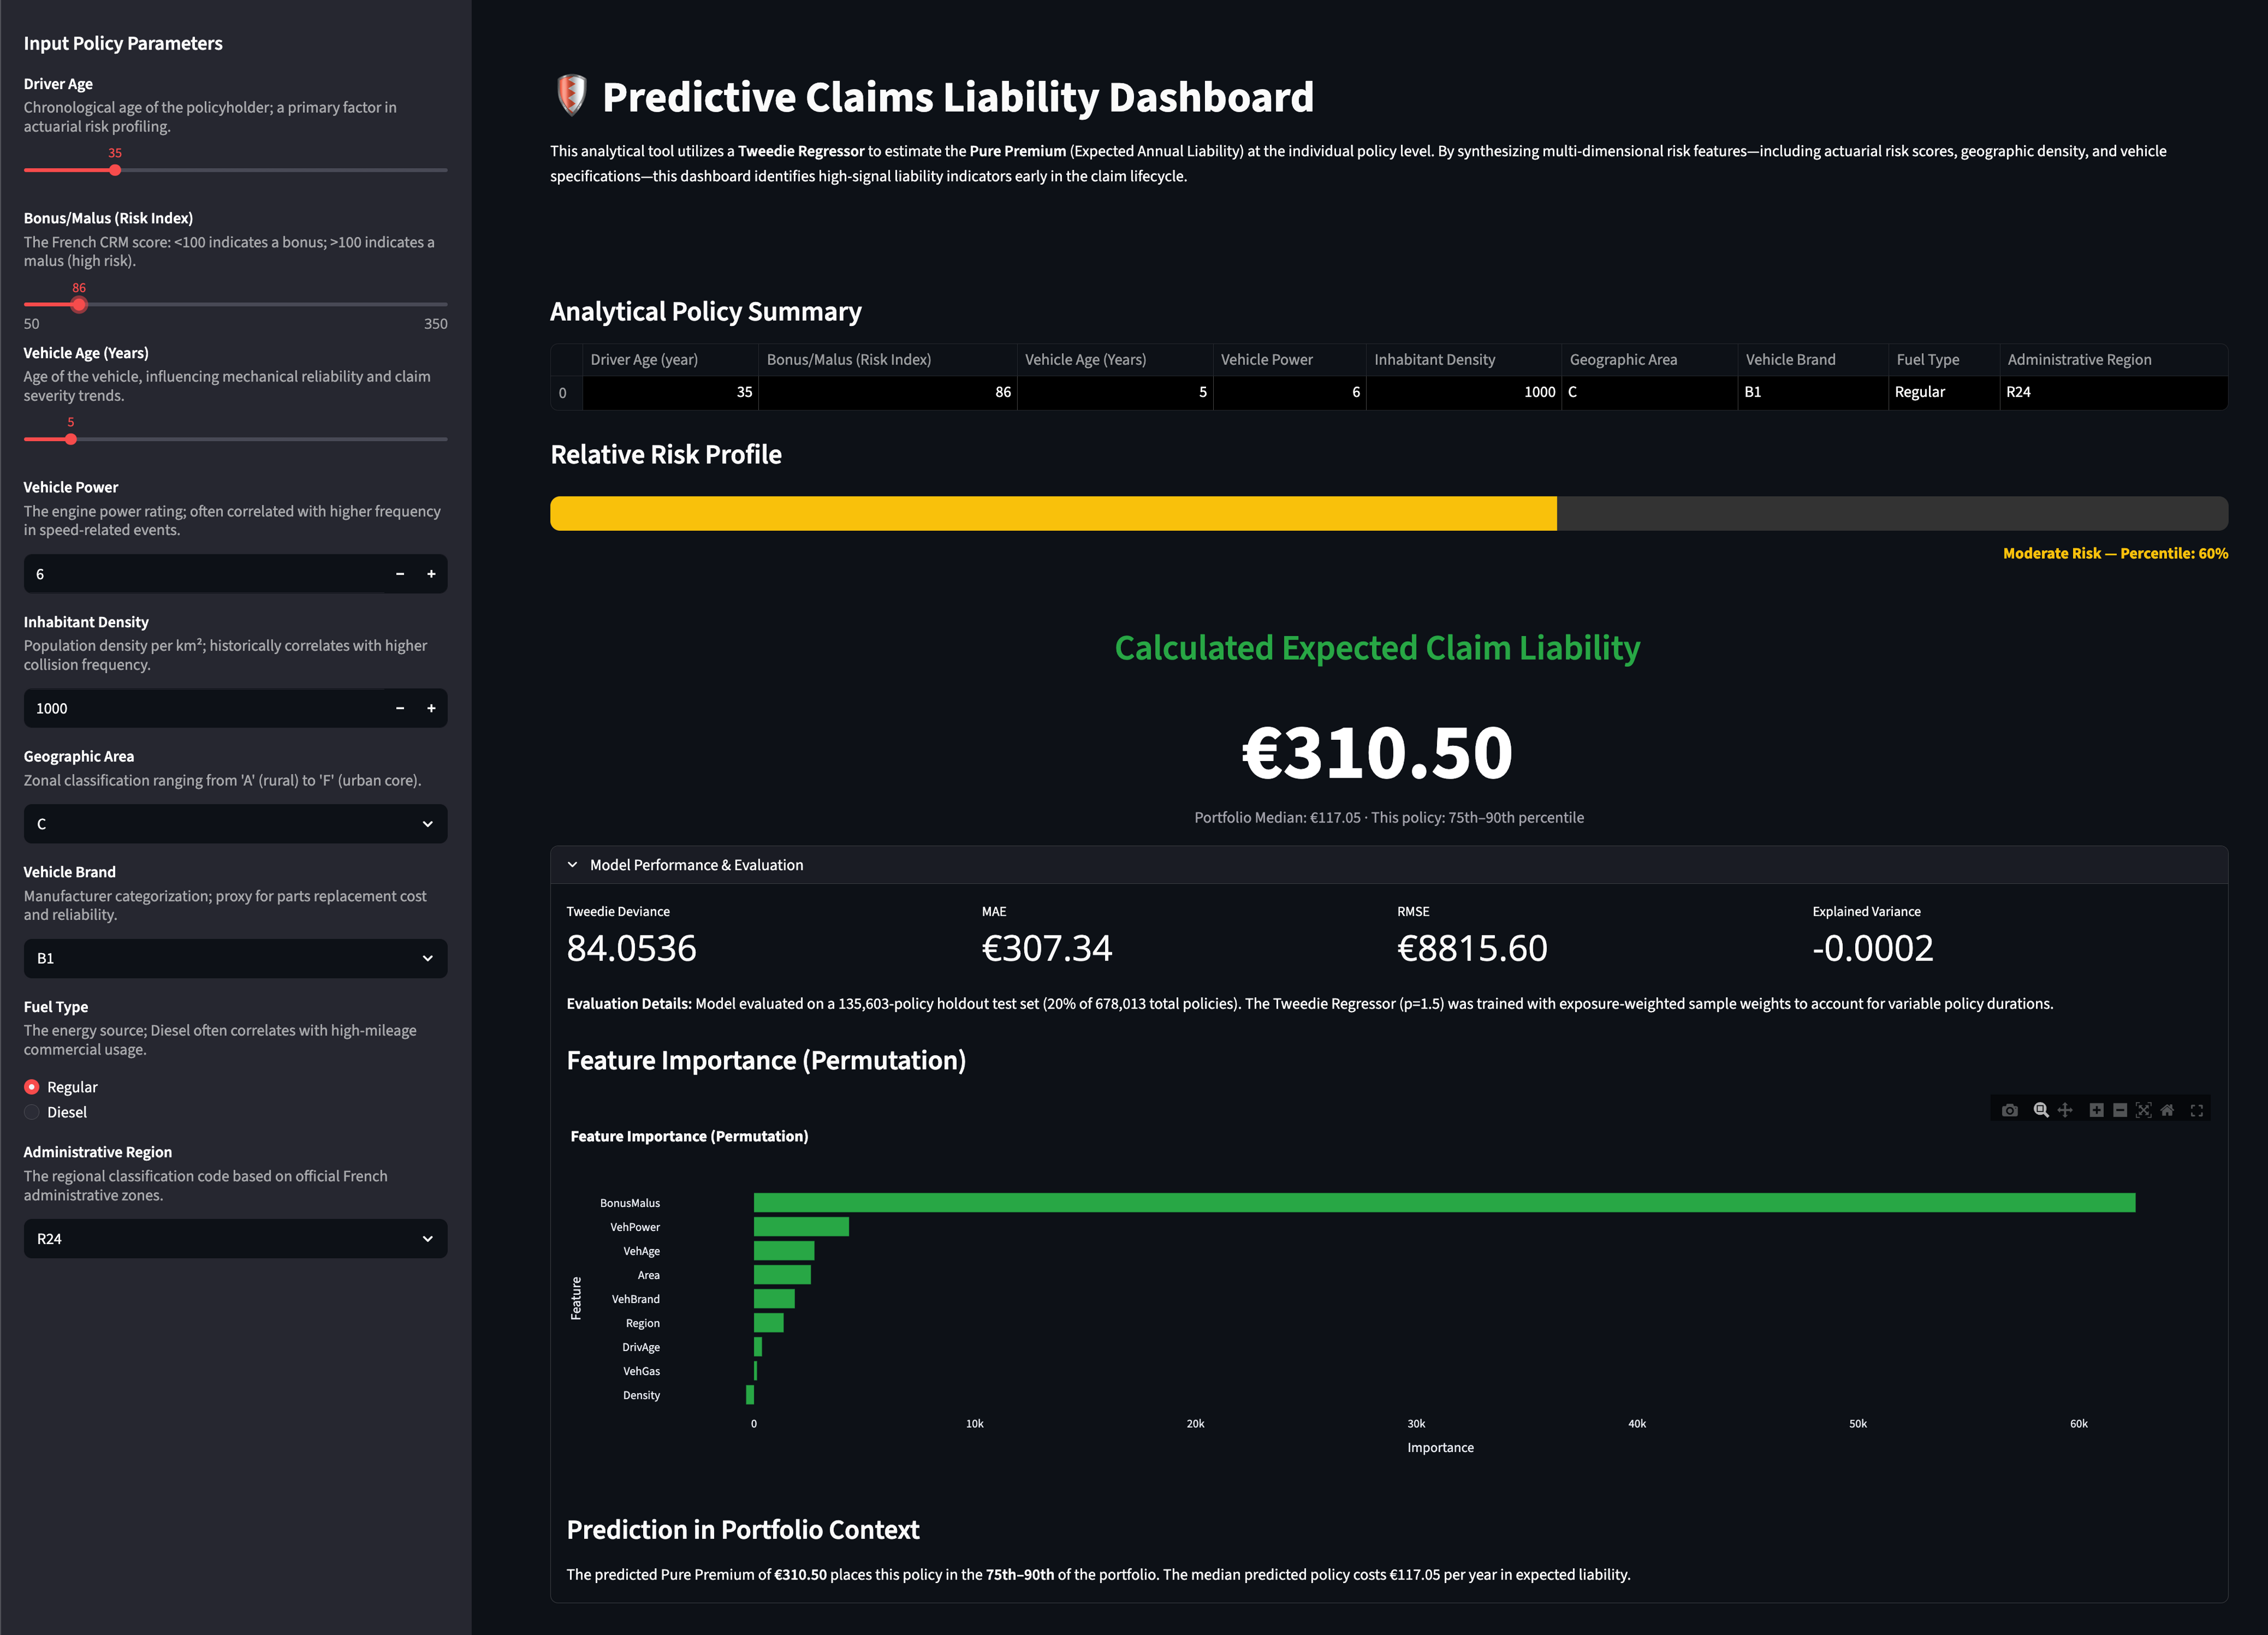
Predictive Claims Liability Dashboard
Dashboard features:
- —Reactive predictions — Pure Premium updates instantly as any input parameter changes
- —Model-derived risk percentile — shows where the predicted liability falls in the portfolio distribution (Low/Moderate/High risk)
- —Portfolio context — each prediction is benchmarked against the portfolio median (€117.05)
- —Model Performance panel — expandable section displaying evaluation metrics and an interactive feature importance chart
📂 Repository Structure
├── app.py # Streamlit dashboard (entry point)
├── requirements.txt # Python dependencies
├── README.md
│
├── model/ # Trained model & evaluation artifacts
│ ├── tweedie_model.pkl # Serialised Tweedie pipeline (joblib)
│ ├── model_metrics.json # Evaluation metrics for dashboard
│ ├── portfolio_stats.json # Portfolio distribution stats
│ └── feature_importance.json # Permutation importance results
│
├── notebooks/ # Training & analysis
│ └── ClaimsLiabilityPredictiveModel.ipynb
│
├── data/ # Source datasets
│ ├── freMTPL2freq.csv
│ └── freMTPL2sev.csv
│
├── assets/ # Generated charts
│ ├── pred_vs_actual.png
│ ├── residuals_distribution.png
│ └── feature_importance.png
│
└── docs/ # Reference documents
├── ClaimsLiabilityPredictiveModel.pdf
└── freMTPL2 French Motor Third-Party Liability dataset.pdf
Limitations & Future Work
Current Limitations:
- —Single observation year — no temporal validation possible
- —French Motor TPL market — findings are not directly transferable to Australian portfolios without recalibration
- —No external validation dataset
- —Tweedie power parameter (p=1.5) set by domain convention, not optimised via grid search
- —No feature interaction terms explored
Future Improvements:
- —Grid search on Tweedie
powerparameter (1.0 < p < 2.0) - —Cross-validation with exposure-weighted folds
- —Feature interaction terms (e.g., DrivAge × BonusMalus)
- —Geographic risk clustering using Inhabitant Density and Region
- —Comparison with Gradient Boosted Tweedie (e.g., LightGBM with Tweedie objective)
- —Technical Proof of Concept: Demonstrates the ability to build "data apps" that allow stakeholders to explore real-time risk profiles independently.
- —Enhanced Risk Oversight: Moves the analytical framework from retrospective reporting to proactive forecasting.
- —Actionable Insights: Translates complex actuarial indicators (e.g., Bonus/Malus scores and Inhabitant Density) into clear, concise financial recommendations for senior stakeholders.